Statistics 101: One-way ANOVA, Understanding the Calculation
TLDRThis video tutorial offers a comprehensive guide on the one-way analysis of variance (ANOVA), starting with basic concepts and progressing to practical calculations in Microsoft Excel. The host encourages positivity for those struggling with statistics, explains terms like SSC, SSE, and SST, and demonstrates how to manually calculate ANOVA components. The video concludes with using Excel's built-in ANOVA tool for verification, emphasizing the importance of understanding statistical foundations before relying on software.
Takeaways
- 😀 Stay positive and keep your head up when struggling in class, as it indicates you've accomplished a lot and just hit a temporary rough patch.
- 📚 The video series is aimed at individuals who are new to statistics, covering basic concepts in a slow and deliberate manner.
- 🔗 Encouragement to follow the presenter on various social media platforms for updates and to connect with the community.
- 👍 A call to action for viewers to like, share, and comment on the video to support the content creator and provide feedback.
- 📈 The script covers part two of a larger video on one-way ANOVA, including an example problem and how to replicate SPSS output in Excel.
- 📋 Excel does not have a direct sum of squares formula, so variance formulas are used and adjusted to calculate the required sum of squares.
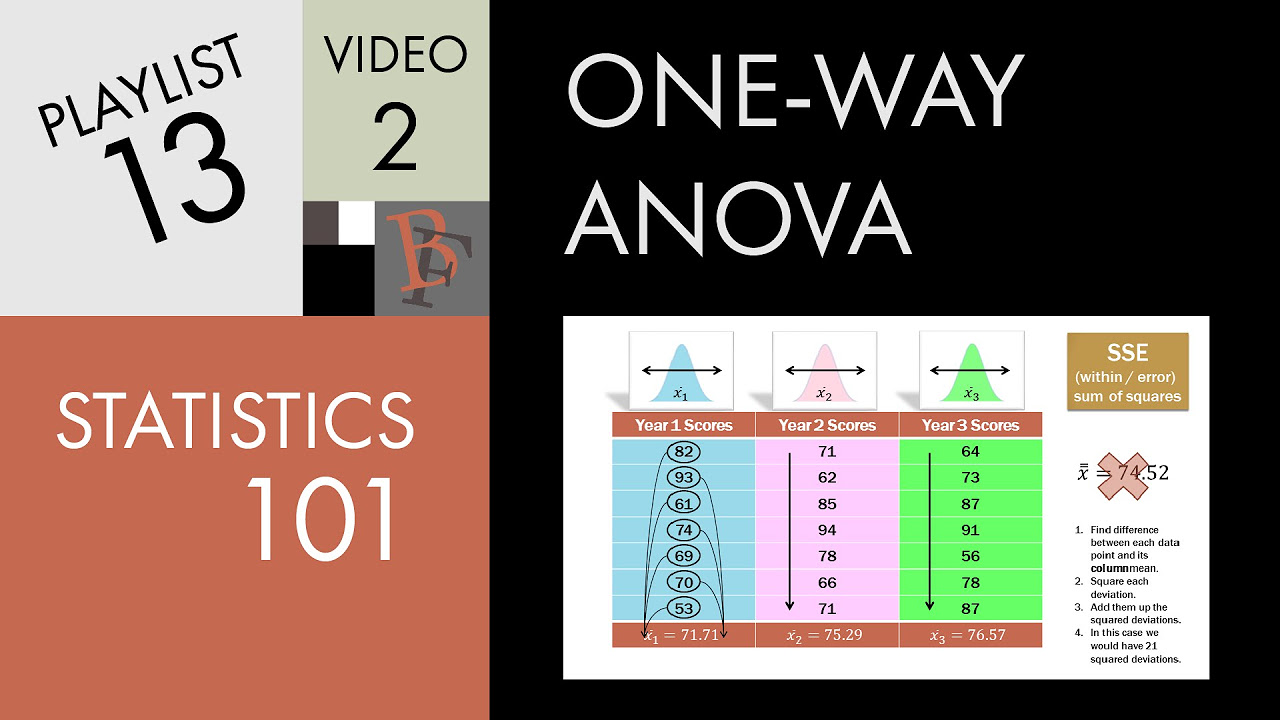
- 🔢 Key formulas for one-way ANOVA are explained, including SSC (sum of squares of columns), SSE (sum of squares of error), and SST (total sum of squares).
- 📊 The F-statistic is calculated as the ratio of MSC (mean square of columns) to MSE (mean square of error), which is crucial for hypothesis testing.
- 📚 The importance of understanding the underlying calculations and formulas of ANOVA is emphasized, even though software is typically used for such analysis.
- 📉 The script demonstrates how to use Excel's built-in ANOVA tool and compares the results with manual calculations to ensure understanding and accuracy.
- 🔑 The final interpretation of the F-statistic in relation to the F-critical value is explained, leading to the conclusion about the null hypothesis in the context of the study.
Q & A
What is the main topic of the video series that Brandon is presenting?
-The main topic of the video series is basic statistics, with a focus on the one-way analysis of variance (ANOVA).
What encouragement does Brandon offer to viewers who might be struggling with their class?
-Brandon encourages viewers to stay positive, keep their head up, and remember that they are smart and talented. He emphasizes that hard work, practice, and patience can help them overcome their current challenges.
How can viewers stay updated with Brandon's new videos?
-Viewers can follow Brandon on YouTube, Twitter, Google+, or LinkedIn to be notified when new videos are uploaded.
What action does Brandon suggest viewers take if they enjoy the video?
-If viewers like the video, Brandon suggests giving it a thumbs up, sharing it with classmates or colleagues, or adding it to a playlist.
What is the purpose of the one-way ANOVA that the video is discussing?
-The purpose of the one-way ANOVA is to compare the means of more than two groups to determine if there are any statistically significant differences between them.
What statistical software does Brandon mention using in his work?
-Brandon mentions using SPSS, which is a statistical software, in his work.
How does Brandon plan to replicate the SPSS output in Excel?
-Brandon plans to use Excel formulas to perform hand calculations that replicate the ANOVA chart output from SPSS.
What are the degrees of freedom for the sum of squares between groups (SSC) in the ANOVA?
-The degrees of freedom for the SSC is the number of columns (C) minus one.
What does the F-statistic represent in the context of ANOVA?
-The F-statistic represents the ratio of two variances, specifically the variance between groups (MSC) divided by the variance within groups (MSE).
How does the video demonstrate the calculation of sum of squares in Excel?
-The video demonstrates the calculation by using Excel's variance formulas, adjusting them to calculate the sum of squares for columns (SSC), error (SSE), and total (SST).
What is the final step Brandon takes to validate the hand calculations in Excel?
-The final step is to use Excel's built-in ANOVA function to obtain an ANOVA table and compare it with the hand calculations to ensure they match.
How does the video conclude regarding the interpretation of the F-statistic?
-The video concludes that if the F-statistic does not exceed the F-critical value, the null hypothesis is not rejected, indicating no significant difference in the means of the groups being compared.
What is the next step or topic hinted at the end of the video?
-The next step or topic hinted at is the two-way ANOVA, which involves comparing means across more complex scenarios with two factors.
Outlines
📚 Introduction to Basic Statistics Video Series
In the introductory paragraph, Brandon greets viewers and encourages those struggling in class to stay positive, emphasizing their intelligence and potential to overcome challenges with hard work. He invites viewers to follow him on various social media platforms to stay updated on new content, and he asks for engagement through likes, shares, and constructive comments to improve his videos. The video's aim is to explain basic statistical concepts slowly and deliberately, particularly focusing on the one-way ANOVA, and viewers are directed to a blog post for an Excel file to follow along.
🔍 Diving into One-Way ANOVA with Excel
This paragraph explains the transition into using Microsoft Excel to perform a hand calculation of one-way ANOVA, mirroring the output from SPSS, the statistical software used by the presenter. The goal is to replicate the ANOVA chart from SPSS within Excel using formulas. Key terms such as SSC (sum of squares of columns), MSC (mean square of columns), SSE (sum of squares of error), and degrees of freedom are introduced, with a reminder that terminology may vary across textbooks and classes. The presenter also outlines the steps to follow along with the Excel file provided in the blog post.
📘 Understanding Degrees of Freedom and Mean Squares
The third paragraph delves deeper into the formulas and concepts behind ANOVA, specifically discussing degrees of freedom for SSC, MSC, SSE, and SST. The presenter explains how to calculate these values using the total number of observations (N) and the number of columns (C). The paragraph also covers the importance of MSE (mean squared error) in statistics and how it is derived. The presenter prepares to demonstrate the calculations in Excel, emphasizing that these steps are for educational purposes rather than practical necessity.
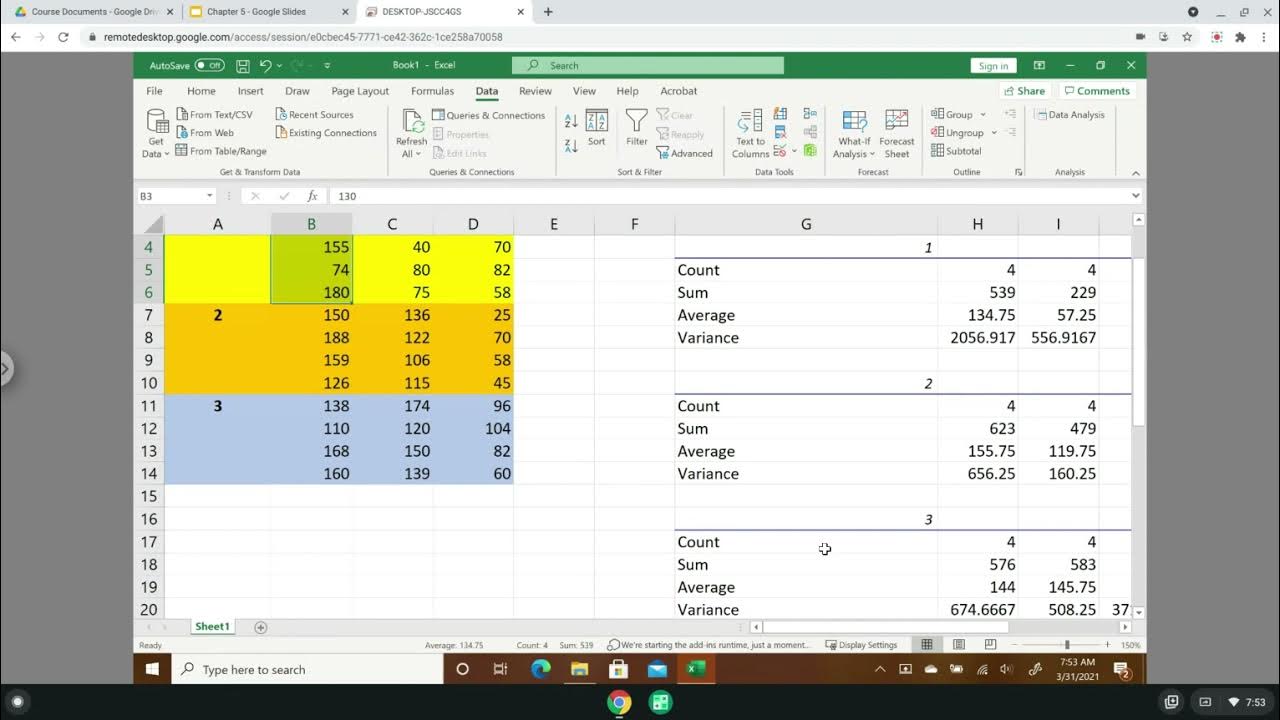
📋 Excel Setup for ANOVA Hand Calculation
In this paragraph, the setup for the hand calculation of ANOVA within Excel is described. The presenter discusses the importance of understanding sum of squares and how Excel's variance formulas can be adapted for this purpose. The Excel spreadsheet is organized to include data, column summaries, overall mean, and a reference to SPSS output. The presenter also outlines the steps to input data and calculate column means, setting the stage for further calculations.
🔢 Calculating Degrees of Freedom and Sum of Squares in Excel
The presenter begins the actual calculations within Excel, starting with determining degrees of freedom for between and within groups, as well as the total degrees of freedom. The paragraph details the process of finding the sum of squares for SSC, SSE, and SST, using modified variance formulas due to Excel's limitations. The presenter emphasizes the importance of understanding where each value comes from and how the calculations are related.
📉 Replicating SPSS Output with Excel Formulas
This paragraph focuses on the process of replicating the SPSS output within Excel by hand. The presenter demonstrates how to calculate the MSC (mean square between groups) and MSE (mean square within groups) using the previously calculated sum of squares and degrees of freedom. The F-ratio is then determined by dividing the MSC by the MSE, and the presenter shows that the values obtained match those from the SPSS output.
🛠️ Using Excel's Built-In ANOVA Tool for Verification
The presenter introduces Excel's built-in ANOVA tool to verify the manual calculations performed earlier. By inputting the data range and selecting the appropriate options, the tool generates an ANOVA table that includes summaries for each group and the ANOVA table itself. The results are compared to the manual calculations and the SPSS output, confirming the accuracy of the hand calculations.
📊 Interpreting the ANOVA Results and Looking Forward to Two-Way ANOVA
In the final paragraph, the presenter interprets the ANOVA results, explaining the F-ratio and its comparison to the critical F-value from the F-distribution. The conclusion is that there is no significant difference in the means of the test scores by year of student. The presenter also briefly introduces the concept of two-way ANOVA for analyzing more complex scenarios involving multiple factors. The video concludes with motivational words for viewers, encouraging continuous learning and improvement.
Mindmap
Keywords
💡Statistics
💡One-way ANOVA
💡Degrees of Freedom
💡Sum of Squares
💡Mean Square
💡F-statistic
💡Excel
💡SPSS
💡Null Hypothesis
💡Critical Value
💡Constructive Comment
💡Two-way ANOVA
Highlights
Introduction to the video series on basic statistics and encouragement for viewers struggling with the subject.
Advice on staying positive and the importance of perseverance in overcoming academic challenges.
Invitation to follow the presenter on various social media platforms for updates and engagement.
Encouragement to like, share, and provide feedback on the video to support content creation.
Explanation of the video's focus on basic concepts of statistics for beginners, delivered in a slow and deliberate manner.
Introduction to the one-way ANOVA and its significance in statistical analysis.
Overview of the one-way ANOVA example problem and its breakdown from part one of the video series.
Demonstration of how to perform a one-way ANOVA calculation using Microsoft Excel.
Description of the process to replicate SPSS output in Excel for educational purposes.
Explanation of key ANOVA terms such as SSC, MSC, SSE, MSE, and F-statistic, and their roles in the analysis.
Clarification of the differences in terminology used by various textbooks and professors for ANOVA components.
Instruction on calculating degrees of freedom for SSC, SSE, and SST in the context of ANOVA.
Guidance on using Excel formulas to calculate sum of squares for columns and error within the ANOVA framework.
Discussion on the importance of understanding the underlying calculations behind statistical software outputs.
Step-by-step walkthrough of entering data and performing calculations in Excel to replicate ANOVA results.
Use of Excel's built-in ANOVA tool to verify manual calculations and demonstrate consistency of results.
Interpretation of the F-statistic in the context of the null hypothesis and its comparison with the F-critical value.
Conclusion on the non-significance of the differences in mean test scores among different years of students based on the ANOVA results.
Introduction to the concept of two-way ANOVA as an extension of one-way ANOVA for more complex analyses.
Final encouragement for viewers to maintain a positive attitude towards learning and self-improvement.
Transcripts
Browse More Related Video
Statistics 101: One-way ANOVA, A Visual Tutorial
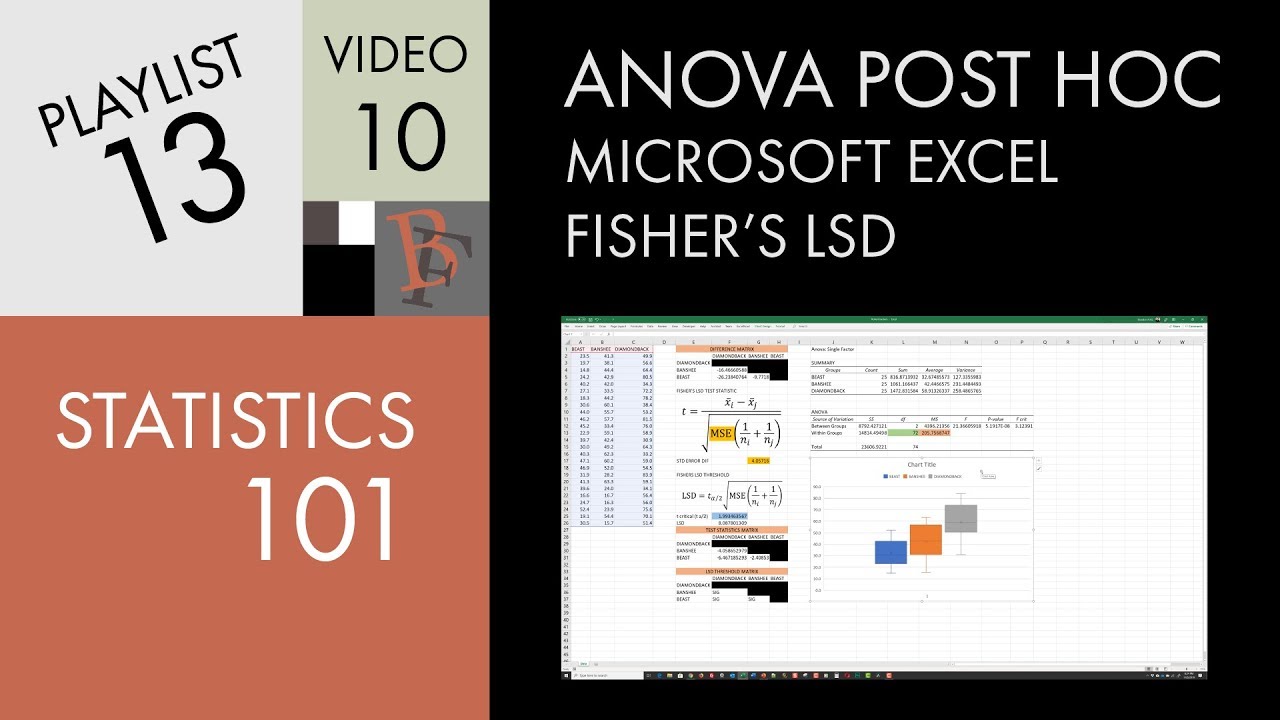
Statistics 101: ANOVA Post Hoc in Excel (Fisher's LSD)
ANOVA: One-way analysis of variance
ANOVA: Two Factor with replication, Residuals Analysis, and Tukey Test
ANOVA (Analysis of variance) simply explained
Statistics 101: ANCOVA in Excel, What's Going On?
5.0 / 5 (0 votes)
Thanks for rating: