Statistics 101: ANCOVA in Excel, What's Going On?
TLDRThis video tutorial by Brandon delves into the Analysis of Covariance (ANCOVA), a statistical method used to control for the effect of a covariate when analyzing the impact of one or more factors on a dependent variable. The video provides a step-by-step guide on performing ANCOVA using Excel, starting with basic data setup and progressing to regression analysis and ANOVA on residuals. The tutorial emphasizes the importance of understanding the proportion of variance explained by the covariate before assessing the significance of the factors. It concludes with the interpretation of the results, highlighting the significance of the covariate and the non-significance of the year factor in the study.
Takeaways
- 📚 The video is part of a series on basic statistics, focusing on Analysis of Covariance (ANCOVA).
- 👋 Introductions are made for both new and returning viewers, encouraging engagement through likes and sharing.
- 🔗 Links to playlists and subscriptions are provided in the video description for further learning.
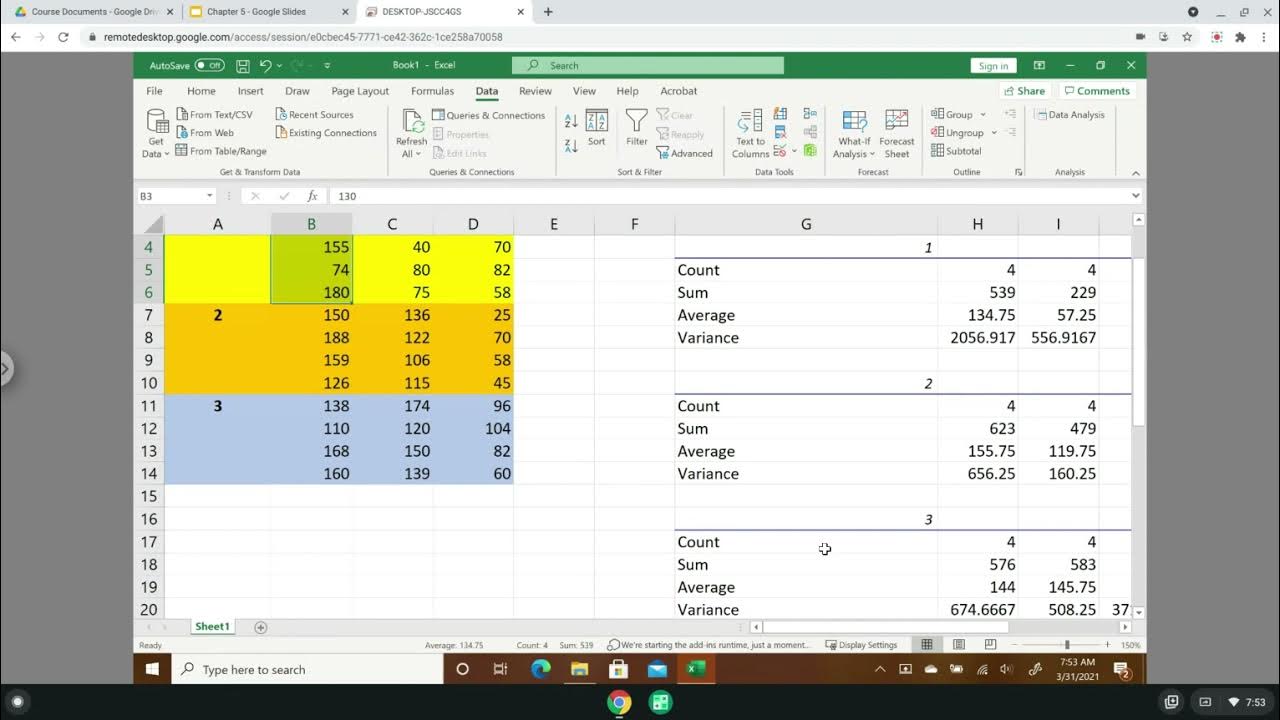
- 📈 The demonstration takes place in Excel, using a dataset with college students' study skills scores, year in school, and GPA.
- 🧐 The fundamental question addressed is the variation in study skills scores after accounting for GPA.
- 📊 The process involves running a regression model with the dependent variable (study skills scores), the single-factor (year in school), and the covariate (GPA).
- 📉 The significance of the model is determined by the proportion of total sum of squares explained by the regression model.
- 📚 An Excel add-in called XLSTAT is recommended for advanced statistical analysis, confirming the results obtained from Excel's native functions.
- 🔑 A high correlation between GPA and study skills scores indicates that GPA accounts for a significant portion of the variation in scores.
- 🔍 By performing regression with only the covariate, it's shown that GPA alone accounts for over half of the total sum of squares.
- 📝 The residuals, which represent the variation not explained by GPA, are used to perform a one-way ANOVA to assess the effect of the year in school.
- 🔮 The final ANCOVA model reveals that GPA is significant, while the effect of the year in school is not, providing insights into the underlying factors affecting study skills scores.
Q & A
What is the main topic of the video?
-The main topic of the video is the explanation of Analysis of Covariance (ANCOVA) and its process using Excel.
What are the three components of the data set used in the video?
-The three components are the dependent variable (study skills scores for college students), the single-factor (year in school), and the covariate (GPA).
Why is it important to account for the variation in scores based on GPA first in ANCOVA?
-Accounting for the variation in scores based on GPA first helps to determine what proportion of the variation in the dependent variable is explained by the covariate, leaving the residual variation to be analyzed by the single-factor ANOVA.
What is the purpose of dummy coding in the context of this video?
-Dummy coding is used to represent the categorical variable 'year in school' as numerical values (1, 2, 3) for regression analysis in Excel.
What statistical software add-in is mentioned in the video, and why is it recommended?
-XLSTAT is the statistical software add-in mentioned, recommended for its ability to perform advanced statistical techniques within Excel.
How does the video demonstrate the relationship between GPA and scores?
-The video demonstrates the relationship by showing the high correlation between GPA and scores, which is further analyzed through regression analysis.
What is the significance of the R-squared value in the context of this video?
-The R-squared value (0.599) indicates the proportion of the variance in the dependent variable (scores) that is predictable from the covariate (GPA).
What does the video suggest about the effect of 'year' after accounting for GPA?
-The video suggests that after accounting for the significant variance explained by GPA, the effect of 'year' may not be as impactful, as indicated by the non-significant p-value in the final ANOVA.
How does the video explain the process of conducting ANCOVA step by step?
-The video explains the process by first conducting a regression analysis to account for the covariate's effect, then performing a one-way ANOVA on the residuals to analyze the effect of the single-factor.
What is the conclusion of the video regarding the significance of the factors in the ANCOVA model?
-The conclusion is that in the ANCOVA model, GPA was the only significant factor, indicating that it accounts for a substantial amount of the variation in the dependent variable, while the effect of 'year' was not significant after controlling for GPA.
Outlines
😀 Introduction to the Video Series and ANCOVA
Brandon introduces himself and welcomes viewers to his statistics video series. He explains the purpose of the video, which is to explore the analysis of covariance (ANCOVA) using Excel. The video aims to clarify what happens during ANCOVA, with Brandon providing a step-by-step guide in Excel, highlighting key data such as dependent variables, single-factor, and covariates.
📊 Setting Up and Running the ANCOVA Model
Brandon demonstrates how to set up and run an ANCOVA model in Excel. He explains the dummy coding of the year variable and performs a regression analysis using data on college students' study skills scores, year in school, and GPA. The output includes multiple R, R square, ANOVA table, and sum of squares. He verifies the results using XLSTAT, showing consistency in the outputs.
🔍 Analyzing the Impact of GPA on Scores
Brandon explains how to determine the proportion of variance in scores accounted for by GPA alone using regression analysis. He highlights the significance of the correlation between GPA and scores, shows how to calculate R square, and discusses the importance of the p-value and F value in the ANOVA table. He emphasizes that GPA alone accounts for over half of the total sum of squares.
📈 Conducting ANOVA on Residuals
Brandon proceeds to perform a single-factor ANOVA on the residuals after accounting for GPA. He explains the process of extracting residuals for each year group and setting up a new ANOVA. The results show that the between-group variance is much smaller than the within-group variance, leading to a non-significant p-value. He concludes that year does not significantly affect scores after accounting for GPA.
🔧 Understanding the Fundamentals of ANCOVA
Brandon wraps up by summarizing the steps taken in ANCOVA: performing regression on the dependent variable with covariates, and then conducting ANOVA on the residuals. He reiterates that ANCOVA helps determine the extent to which factors have any differences after accounting for covariates. He thanks the viewers and encourages them to continue watching the series for more insights into statistical analysis.
Mindmap
Keywords
💡ANCOVA
💡Dependent Variable
💡Single-Factor
💡Covariate
💡Regression
💡Dummy Coding
💡Residuals
💡ANOVA
💡Correlation
💡XLSTAT
Highlights
Introduction to the video series on basic statistics and a welcome to new and returning viewers.
Invitation to like, share, and subscribe to the channel for more educational content.
Explanation of Analysis of Covariance (ANCOVA) and its purpose in statistical analysis.
Demonstration of ANCOVA using Excel, with a provided link to the data file for follow-along.
Description of the data set involving study skills scores, year in school, and GPA.
Fundamental question posed regarding the variation in scores and the role of GPA.
Step-by-step guide on how to recode the year variable using dummy coding in Excel.
Running a regression model in Excel to understand the relationship between variables.
Interpretation of the regression output, including R-squared and ANOVA table significance.
Use of XLSTAT software to verify and expand upon the Excel regression results.
Highlighting the high correlation between GPA and scores as a key finding.
Detailed breakdown of the process to isolate the effect of the covariate (GPA) on the dependent variable.
Performing a separate regression analysis to determine the variance accounted for by GPA alone.
Discussion on the implications of the large variance explained by GPA for the significance of the year variable.
Introduction of residuals and their role in conducting a one-way ANOVA after accounting for the covariate.
Conducting a one-way ANOVA on residuals to analyze the effect of year after controlling for GPA.
Interpretation of the one-way ANOVA results indicating the insignificance of the year variable.
Final summary of the ANCOVA process and its importance in understanding the underlying statistical analysis.
Closing remarks encouraging further exploration and understanding of statistical methods.
Transcripts
Browse More Related Video
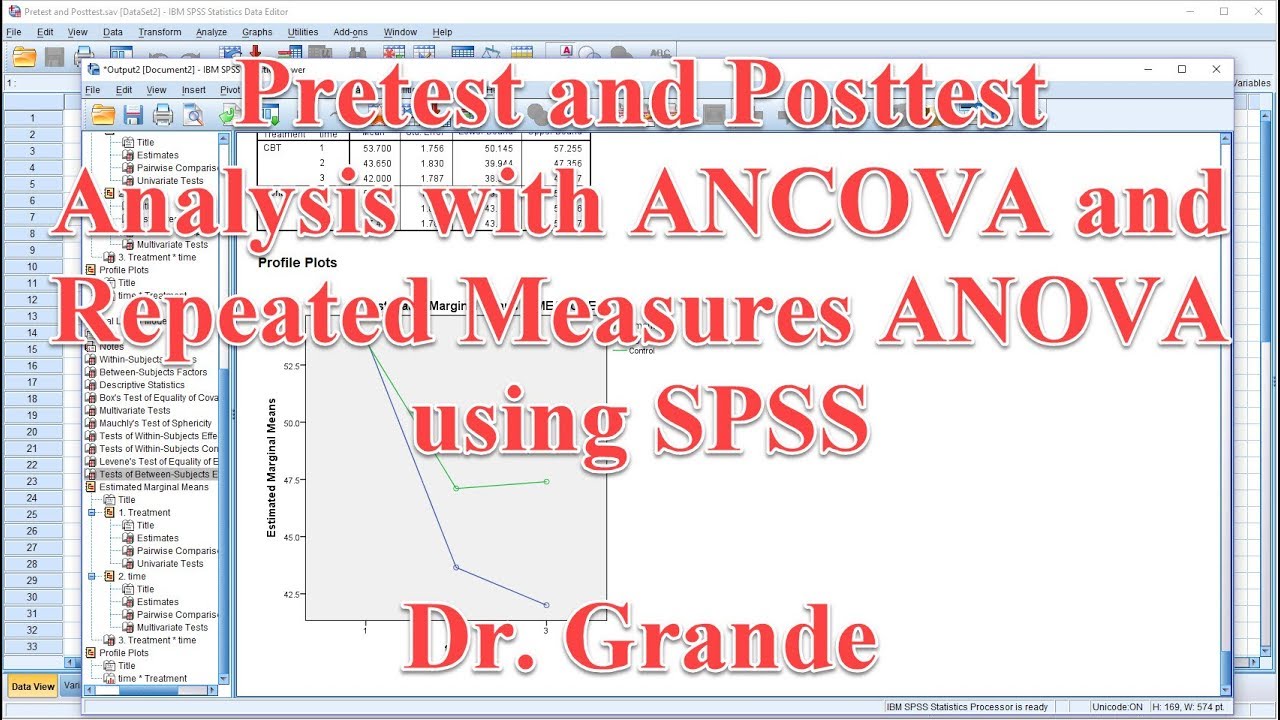
Pretest and Posttest Analysis with ANCOVA and Repeated Measures ANOVA using SPSS
Analysis of Covariance (ANCOVA) + R Demo
ANOVA: Two Factor with replication, Residuals Analysis, and Tukey Test

Two Factor ANOVA [without repeated measures]
Statistics 101: Two-way ANOVA with Replication, An Introduction
Statistics 101: One-way ANOVA, Understanding the Calculation
5.0 / 5 (0 votes)
Thanks for rating: