Percentiles - How to calculate Percentiles, Quartiles, ...
TLDRThis video tutorial demonstrates how to calculate various percentiles, including the 46th, 75th, and 90th, using a formula and Excel. The script begins by arranging data in ascending order and applying a locator formula to determine the position of each percentile. It then illustrates manual calculations for P46, Q3, and D9, followed by using Excel functions like Percentile.EXC and Quartile.EXC to achieve the same results. The video concludes by comparing manual and Excel results, showcasing the ease of calculating percentiles in Excel.
Takeaways
- 📊 The video demonstrates how to calculate percentiles both manually using a formula and with Excel.
- 📝 The data provided represents scores on an exam, and the goal is to find specific percentiles: P46, Q3, and D9.
- 🔢 The data must be arranged in ascending order and numbered to identify positions for percentile calculation.
- 📌 A locator formula is used to find the position of a given percentile, where Lp = (n + 1) * (p/100).
- 🧮 For P46, the calculation involves finding the position between the 5th and 6th observations and determining the value at 52% of the distance between them.
- 📈 The 46th percentile is calculated as 22 + 0.52 * (25 - 22), resulting in a value of 23.56.
- 📊 Q3, or the 75th percentile, is found by locating the 9th value in the ordered dataset, which is 32 in this case.
- 🔢 For D9, or the 90th percentile, the calculation involves the 0.8 of the distance between the 10th and 11th observations, resulting in 37.8.
- 💻 In Excel, percentiles can be calculated using functions like Percentile.EXC for exclusive percentiles.
- 🔑 The Percentile.EXC function in Excel is used to ensure that exactly p% of the data is less than the result.
- 📊 Excel offers alternative functions like Quartile for specific percentiles, such as the 75th percentile (Q3).
- 📋 The video concludes with the same results obtained in Excel as with the manual formula, showcasing the consistency of the methods.
Q & A
What is the main topic of the video?
-The main topic of the video is calculating percentiles using both a formula and Excel.
What are the specific percentiles discussed in the video?
-The video discusses calculating P46 (46th percentile), Q3 (3rd quartile or 75th percentile), and D9 (9th decile or 90th percentile).
Why is it important to arrange the data in ascending order and number them?
-Arranging the data in ascending order and numbering them helps in easily identifying the positions of the observations, which is necessary for finding percentiles.
What is the locator formula used to find the position of a percentile?
-The locator formula used is Lp = (n + 1) * p/100, where Lp is the position locator of the pth percentile, n is the number of observations, and p is the percentile.
How is the 46th percentile calculated using the locator formula?
-The 46th percentile is calculated by finding the position using the locator formula, which gives 5.52, indicating it's between the 5th and 6th observations. Then, it is calculated as 22 + 0.52 * (25 - 22) = 23.56.
What Excel function is used to calculate the 46th percentile, and why is it chosen over the other option?
-The Excel function Percentile.EXC is used to calculate the 46th percentile because it ensures that exactly 46% of the data is strictly less than the result.
How is the 75th percentile, also known as the third quartile, calculated in Excel?
-The 75th percentile can be calculated using either the Percentile.EXC function or the Quartile.EXC function, with the data range selected and 3 entered for the 3rd quartile.
What Excel function and value are used to calculate the 90th percentile, and why?
-The Percentile.EXC function is used with a value of .9 to calculate the 90th percentile, ensuring that 90% of the data is less than the result.
Why are two different Excel functions mentioned for calculating the third quartile?
-Two different functions, Percentile.EXC and Quartile.EXC, are mentioned to show alternative methods available in Excel for the same calculation, providing flexibility.
What does the video demonstrate about the relationship between manual calculation and Excel calculations for percentiles?
-The video demonstrates that both manual calculations using the formula and Excel calculations yield the same results, showing the accuracy and convenience of using Excel for percentile calculations.
How does the video conclude?
-The video concludes by summarizing the process of calculating percentiles manually and in Excel, and thanking the viewers for watching.
Outlines
📊 Calculating Percentiles Manually and in Excel
This paragraph introduces the video's objective to demonstrate the calculation of various percentiles: the 46th percentile, the 3rd quartile (75th percentile), and the 9th decile (90th percentile) using a formula and Excel. It explains the initial step of arranging the data in ascending order and numbering the observations for easy identification. The paragraph details the locator formula for finding the position of a percentile, using the example of finding the 46th percentile by interpolating between the 5th and 6th observations. The manual calculation of the 46th, 75th, and 90th percentiles is shown, with the results being 23.56, 32, and 37.8 respectively.
Mindmap
Keywords
💡Percentiles
💡Quartiles
💡Deciles
💡Data Arrangement
💡Position Locator
💡Excel Functions
💡Percentile.EXC
💡Quartile Function
💡Manual Calculation
💡Data Distribution
Highlights
Introduction to calculating percentiles using a formula and in Excel.
Explanation of data set representing exam scores.
Goal: Find P46 (46th percentile), Q3 (75th percentile), and D9 (90th percentile).
Step-by-step calculation of P46 (46th percentile) using locator formula.
Calculation details: L46 = (11 + 1) * 46/100 = 5.52.
Result: 46th percentile is 23.56, meaning 46% of scores are less than 23.56.
Calculation of Q3 (75th percentile) using locator formula.
Result: 75th percentile is the 9th value, which is 32.
Calculation of D9 (90th percentile) using locator formula.
Result: 90th percentile is 37.8.
Excel method: Using Percentile.EXC function for P46.
Excel method: Using Quartile function for Q3.
Excel method: Using Percentile.EXC function for D9.
Comparison: Results in Excel match manual calculations.
Conclusion: Demonstration of calculating percentiles manually and in Excel.
Transcripts
Browse More Related Video
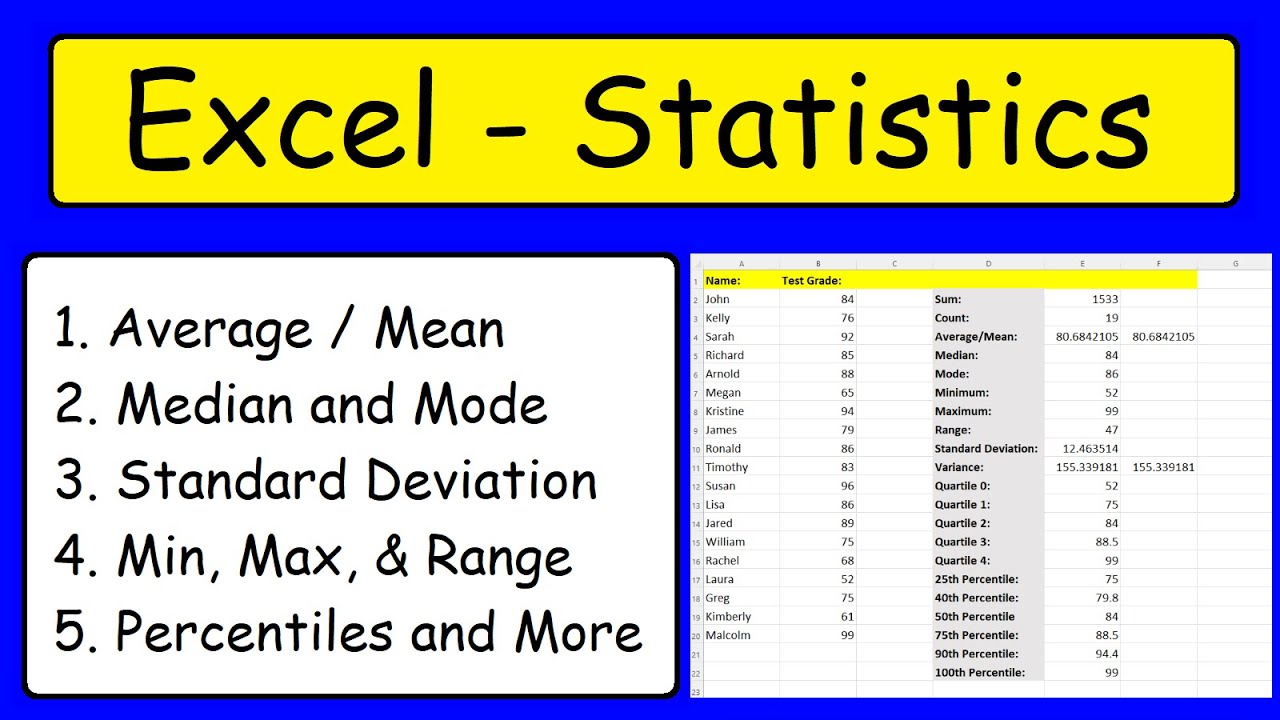
Statistics - Excel
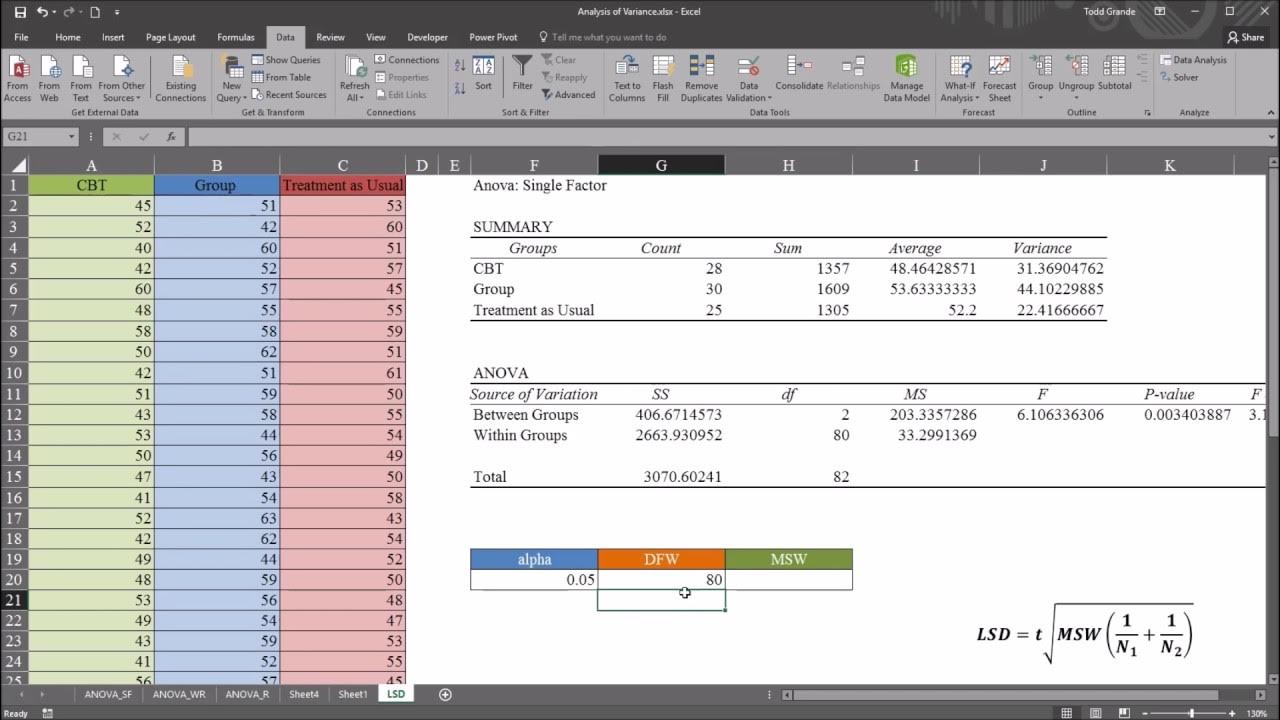
One-Way ANOVA with LSD (Least Significant Difference) Post Hoc Test in Excel
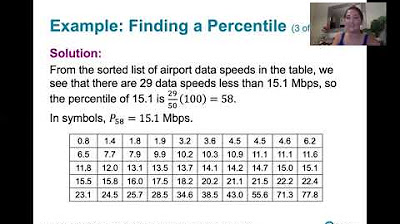
3.3.2 Measures of Relative Standing and Boxplots - Percentiles
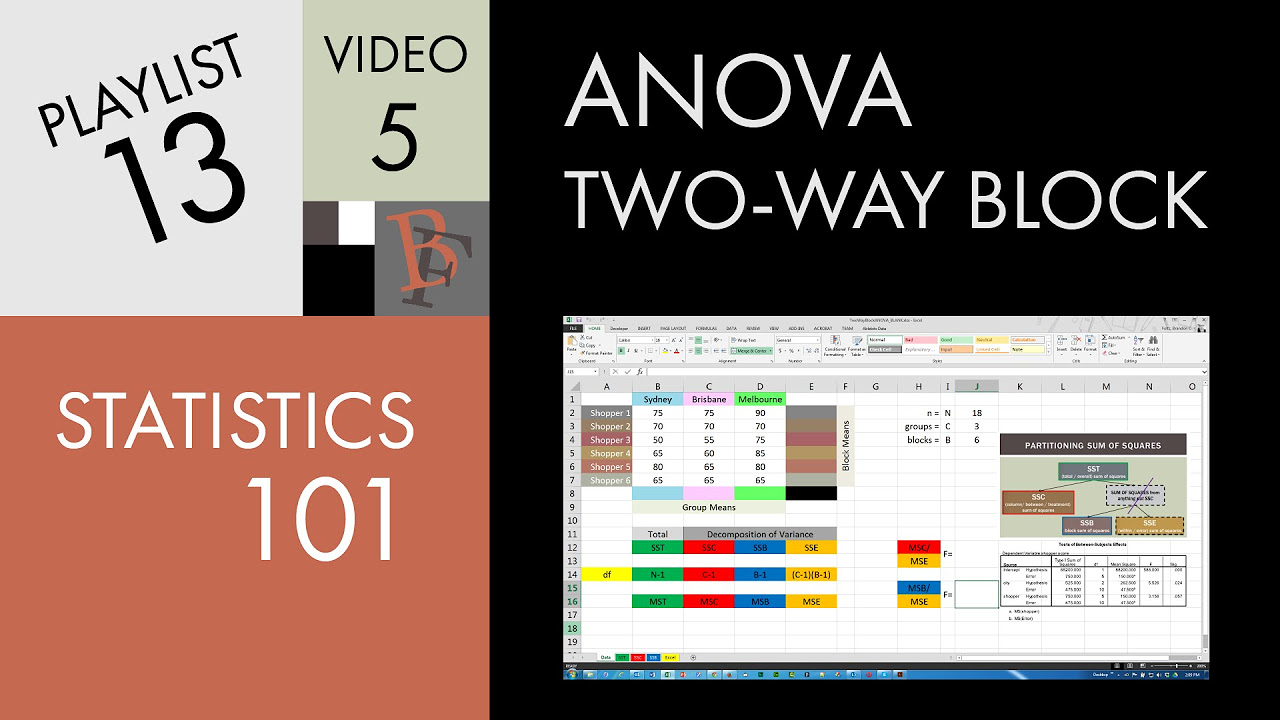
Statistics 101: Two-way ANOVA w/o Replication, The Calculation
Calculating The Standard Deviation, Mean, Median, Mode, Range, & Variance Using Excel

REAL Excel Interview Tests for Business & Finance Roles
5.0 / 5 (0 votes)
Thanks for rating: