Percentiles and Percentile Ranks
TLDRThis script explains the concept of percentiles and percentile ranks, often misunderstood. It clarifies that being in the 90th percentile does not mean scoring 90% but rather that 90% of the class scored lower or equal to the student's score. The script uses an example with exam scores to illustrate this point. It further discusses how to calculate cumulative frequencies and percentile ranks, using the number of siblings as an example, and emphasizes the importance of distinguishing between the raw scores (percentiles) and their corresponding ranks in a distribution.
Takeaways
- 📊 The term 'percentile' commonly refers to a 'percentile rank', which indicates the relative standing of a score within a group.
- 🎓 Being in the 90th percentile means that 90% of the class scored equal to or lower than your score, not that you scored 90% on the exam.
- 🔢 Percentile rank is not the same as a percentile, which is a score; the percentile rank is the percentage of scores below a given score.
- 📚 Understanding the difference between percentile and percentile rank is crucial to avoid confusion, especially in educational and statistical contexts.
- 📈 To calculate percentile ranks, you must first determine the cumulative frequencies, which are the sum of frequencies from the lowest to the current category.
- 📉 Cumulative percentages, which become percentile ranks, are calculated by dividing the cumulative frequency by the total number of observations (N) and multiplying by 100.
- 📋 The highest cumulative frequency will always result in a percentile rank of 100%, as all individuals in the sample scored less than or equal to the highest score.
- 📊 Percentile ranks are used to determine the distribution of scores, showing how many individuals scored below a certain point.
- 📝 When categories cover a range of scores, percentile ranks correspond to the upper real limit of those ranges, not the raw scores themselves.
- 🔑 To find the percentile rank of a specific score, locate the upper real limit of the category it falls into and match it with the corresponding cumulative percentage.
- 📘 Creating a listing of percentiles and percentile ranks involves calculating cumulative frequencies and then converting them into cumulative percentages to understand score distributions.
Q & A
What does the term 'percentile' commonly refer to in everyday language?
-In everyday language, the term 'percentile' commonly refers to 'percentile rank', which indicates the position of a score in a distribution relative to other scores.
What does it mean to be in the 90th percentile of a class?
-Being in the 90th percentile of a class means that 90% of the class scored equal to or lower than your score, placing you in the top 10% of the class.
Can you fail an exam and still be in the 90th percentile?
-Yes, you can fail an exam and still be in the 90th percentile if 90% of the class scored lower than your score, even if your score is below passing.
What is the difference between a percentile and a percentile rank?
-A percentile is a score that separates the distribution into 100 equal parts, whereas a percentile rank indicates the percentage of scores in a distribution that are below a particular score.
How is the percentile rank calculated for a score?
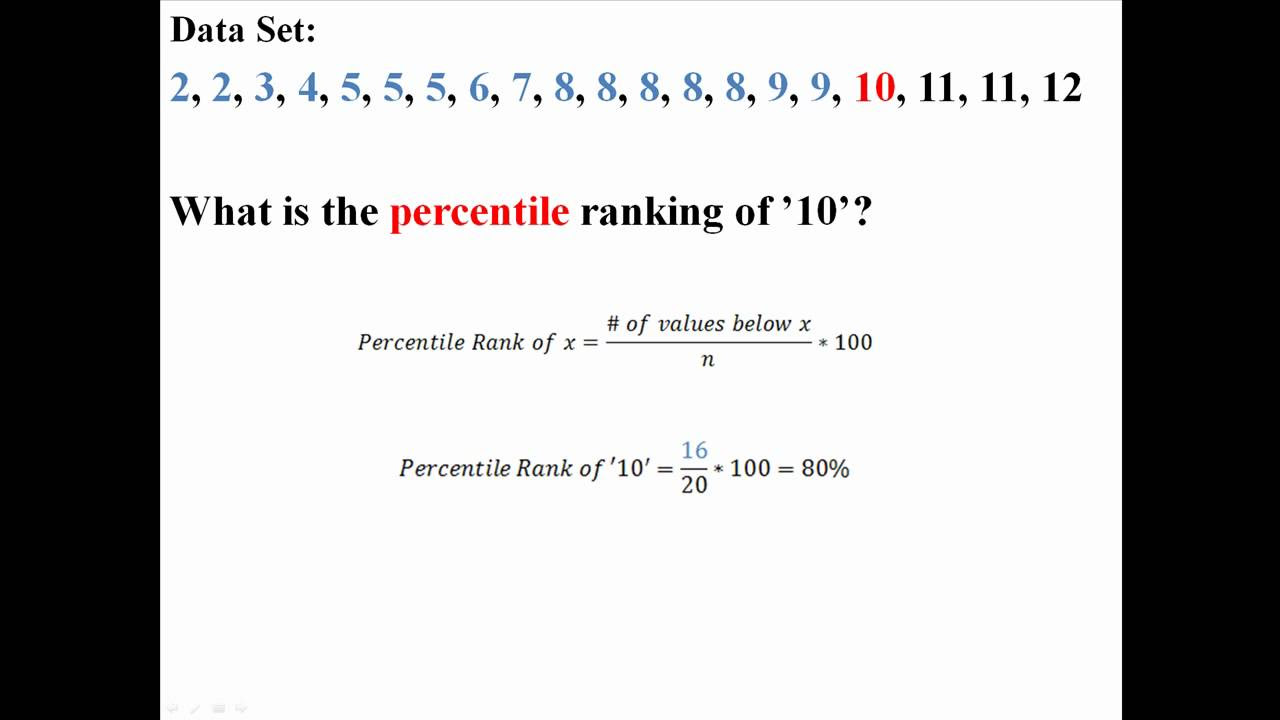
-The percentile rank is calculated by taking the cumulative frequency of scores up to and including that score, dividing it by the total number of scores (N), and then multiplying by 100.
What is a cumulative frequency?
-A cumulative frequency is the total number of occurrences of a particular value or category up to that point in the data set, starting from the lowest category.
Why should the cumulative frequency in the highest category match the sample size?
-The cumulative frequency in the highest category should match the sample size because it represents the total number of individuals in the sample, ensuring that all individuals are accounted for.
How are cumulative percentages used to determine percentile ranks?
-Cumulative percentages are used to determine percentile ranks by dividing the cumulative frequency by the total number of scores (N), and then multiplying by 100, which gives the percentage of scores that are less than or equal to a particular score.
What does the highest cumulative percentage represent in terms of percentile rank?
-The highest cumulative percentage, which is 100%, represents the percentile rank of the highest score in the distribution, indicating that 100% of scores are less than or equal to this top score.
How can you determine the percentile rank of a specific score using the script's example?
-To determine the percentile rank of a specific score, find the corresponding upper real limit of the category that score falls into, and then identify the cumulative percentage associated with that limit, which represents the percentile rank.
Why is it important to distinguish between the raw score and the upper real limit when discussing percentile ranks?
-It's important to distinguish between the raw score and the upper real limit because percentile ranks are associated with the upper real limits of score categories, not the raw scores themselves, as these limits define the range of scores included in each percentile rank.
Outlines
📊 Understanding Percentiles and Percentile Ranks
This paragraph introduces the concept of percentiles, particularly distinguishing between 'percentile' and 'percentile rank.' It explains that being in the 90th percentile means that 90% of the scores are below or equal to a given score, which could be a failing score in some cases. The focus is on clarifying that 'percentile rank' indicates the position of a score within a distribution, while 'percentile' refers to the score itself.
📈 Calculating Cumulative Frequencies
This section explains how to calculate cumulative frequencies, which are essential for determining percentiles and percentile ranks. Starting with the lowest category, the cumulative frequency is the sum of frequencies up to and including the current category. This process helps build a comprehensive frequency distribution, which is crucial for understanding data trends and ensuring accuracy in the analysis.
🔢 Computing Cumulative Percentages
Here, the focus is on calculating cumulative percentages from cumulative frequencies. This involves converting cumulative frequencies to percentages to determine the percentile ranks. The formula given for cumulative percentage is the cumulative frequency divided by the total number of observations (N), multiplied by 100. This calculation helps in identifying the percentile rank for each category in the data set.
📉 Differentiating Percentiles from Raw Scores
This paragraph emphasizes that percentiles are related to the upper real limits of score categories rather than the raw scores themselves. For instance, the percentile rank associated with a score of 3 should actually be considered up to 3.5. The explanation includes how to identify the correct upper limit for each category to accurately determine percentiles and their corresponding ranks.
Mindmap
Keywords
💡Percentile
💡Percentile Rank
💡Cumulative Frequency
💡Score
💡Distribution
💡Upper Real Limit
💡Lower Real Limit
💡Sample Size
💡Cumulative Percentage
💡Percentile Ranks
Highlights
Percentile is often confused with percentile rank, but they represent different concepts.
Being in the 90th percentile means 90% of the class scored equal to or lower than your score, not necessarily getting 90% on the exam.
Even if you fail an exam, you can still be in a high percentile rank if most others scored lower.
Percentile rank indicates the position of a score relative to others in a distribution.
Percentiles are scores, while percentile ranks are the percentages representing the position in a distribution.
It's important to distinguish between reporting a percentile as a score versus a percentile rank as a percentage.
The transcript provides an example of calculating percentile ranks using cumulative frequencies.
Cumulative frequencies are used to find the total number of individuals in each category.
Cumulative percentages are calculated by dividing cumulative frequency by the total sample size and multiplying by 100.
The highest cumulative percentage will always be 100%, as it represents the top score in the distribution.
Percentile ranks are percentages that indicate how many individuals scored less than or equal to a certain score.
Categories in a distribution cover a range of scores, so percentile ranks correspond to the upper real limits of those ranges.
The transcript demonstrates how to calculate percentiles and percentile ranks for different categories of sibling counts.
Percentiles are the actual scores, while percentile ranks are the positions of those scores in the distribution.
The example shows that 82.14% of scores are less than or equal to the upper real limit of 3.5.
To find the percentile rank of a specific score, locate it within the distribution and identify the corresponding cumulative percentage.
The transcript emphasizes the importance of understanding the difference between percentiles and percentile ranks for accurate interpretation.
Transcripts
Browse More Related Video
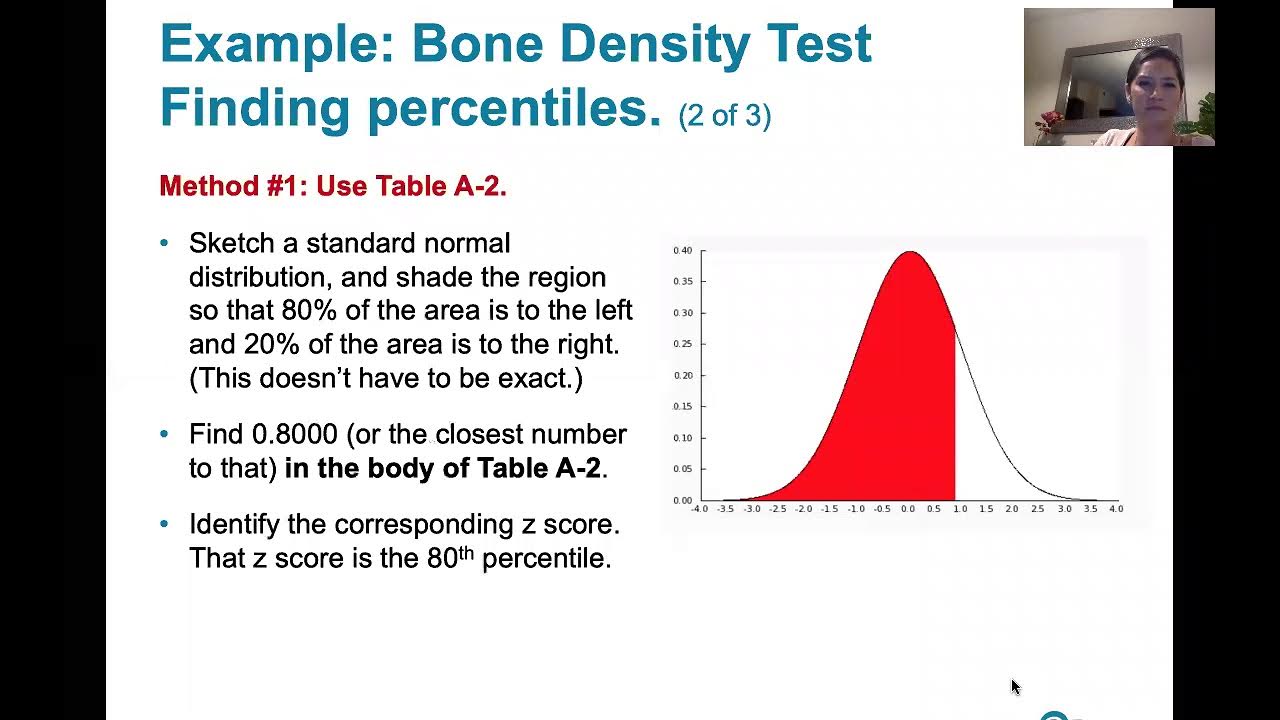
6.1.5 Standard Normal Distribution - z scores Corresponding to Areas. Percentiles. Critical Values.
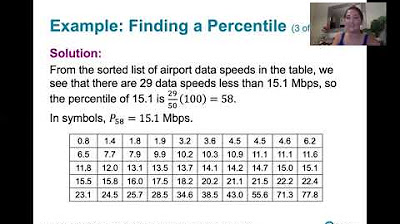
3.3.2 Measures of Relative Standing and Boxplots - Percentiles
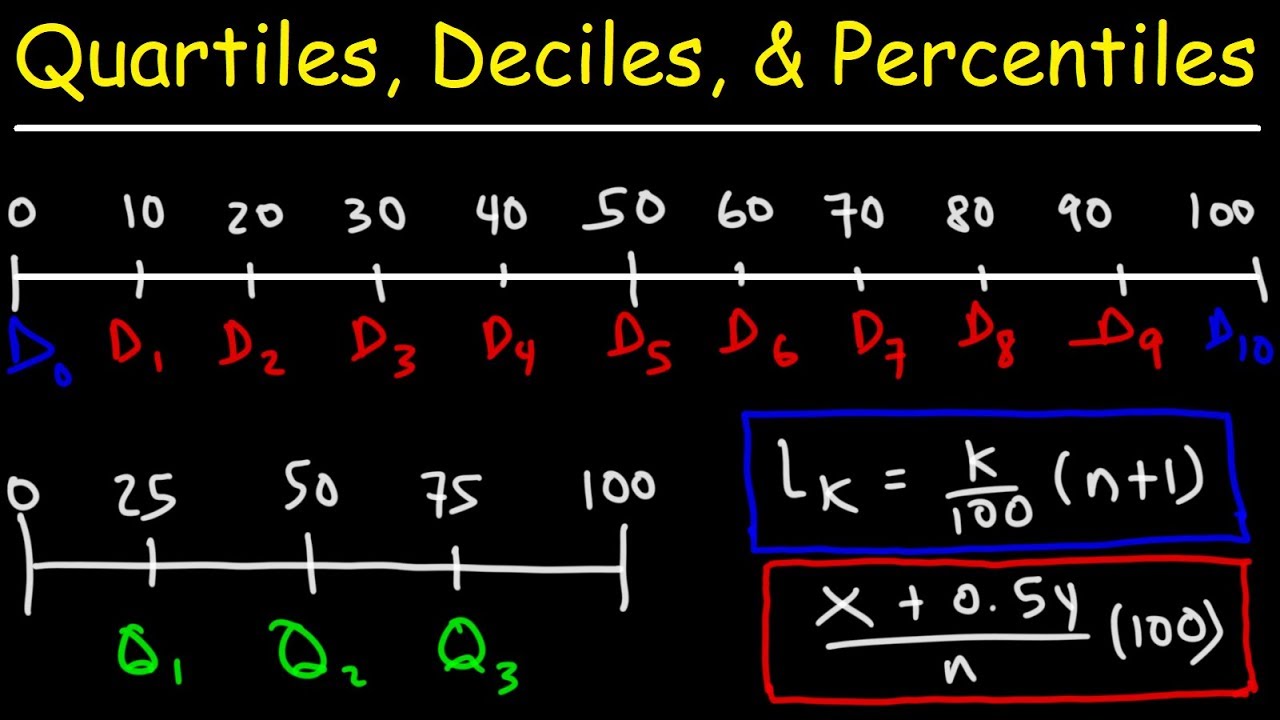
Quartiles, Deciles, & Percentiles With Cumulative Relative Frequency - Data & Statistics
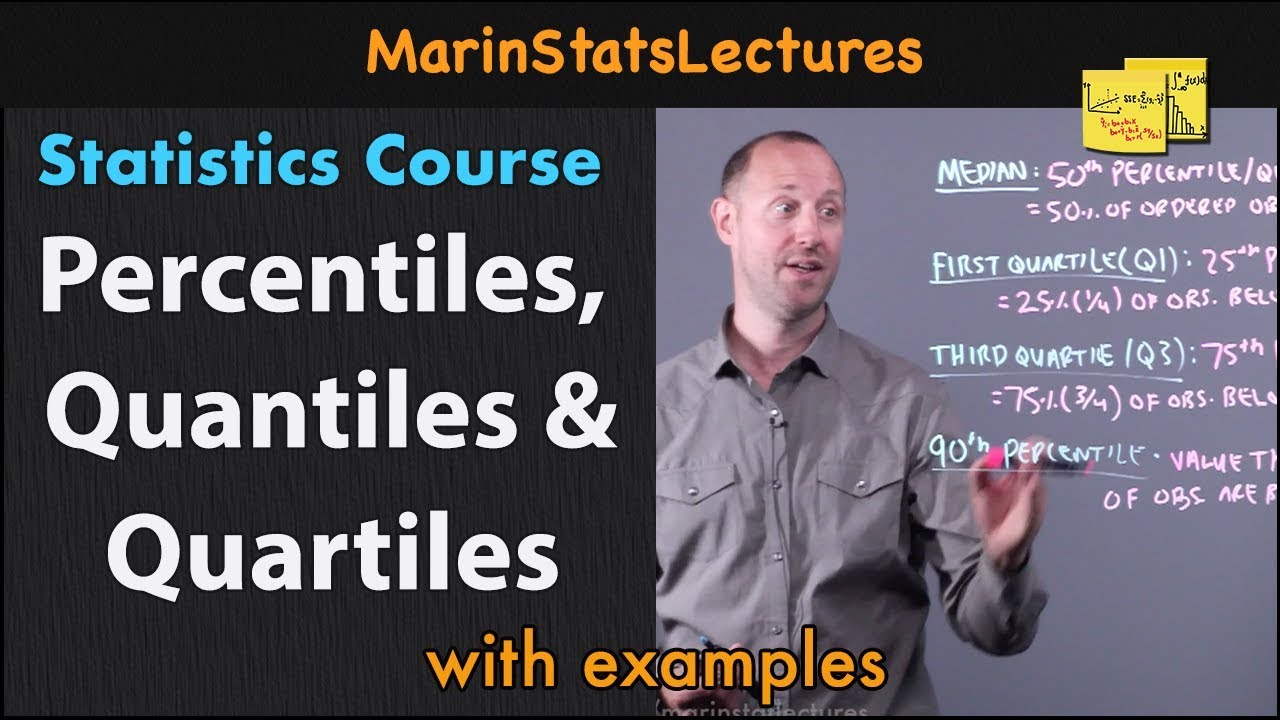
Percentiles, Quantiles and Quartiles in Statistics | Statistics Tutorial | MarinStatsLectures
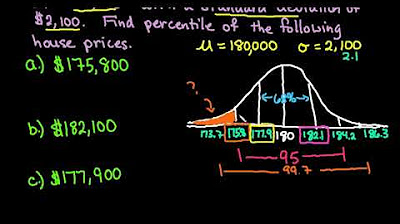
Empirical Rule 68-95-99.7 Rule to Find Percentile
Percentiles and Quartiles
5.0 / 5 (0 votes)
Thanks for rating: