AP Precalculus Practice Exam Question 76
TLDRThe script discusses a scenario where a swimming pool is being emptied by a pump. Initially, the pump works slower due to a broken part, affecting the water removal rate for the first two hours. After the part is replaced, the pump operates at its normal rate, and the pool is emptied in six hours. The correct graph to represent this situation is identified by eliminating options that contradict the given information about the duration and rate of water removal, leading to the conclusion that graph B is the most accurate representation.
Takeaways
- 🏊♂️ The scenario involves a swimming pool being emptied of water using a pump.
- 🔧 Initially, the pump works slower due to a broken piece, affecting the rate of water removal.
- ⏱️ The entire process of emptying the pool takes six hours, with a two-hour period of slower pumping.
- 🛠️ After two hours, the broken piece is replaced, and the pump resumes at its usual rate.
- 📉 The rate at which the volume of water in the pool decreases is constant, except for the first two hours.
- 📈 The graph should depict a change in the rate of water removal at the two-hour mark.
- ❌ Graph A is incorrect as it shows the pool emptying in 10 hours, contradicting the six-hour timeframe.
- 🚫 Graph D is eliminated because it shows a decrease in volume for the first four hours, not just two.
- 🔍 The correct graph must show two distinct rates of change, one for the first two hours and another for the rest.
- 📊 Graph B is identified as the most likely correct answer due to its representation of two different rates of decrease.
- 🔄 The script emphasizes the importance of observing changes in the rate of water removal over time.
Q & A
What is the main subject of the video script?
-The main subject of the video script is the process of emptying a swimming pool using a pump, with a focus on the different rates of water removal due to a broken piece in the pump.
How long does the entire process of emptying the pool take according to the script?
-The entire process of emptying the pool takes six hours.
What is the initial issue with the pump during the first two hours?
-The initial issue with the pump during the first two hours is that it works slower than usual due to a broken piece.
Why is the broken piece of the pump replaced?
-The broken piece of the pump is replaced to restore the pump to its usual working rate and to continue emptying the pool at a faster pace.
What does the script suggest about the rate of water removal during the first two hours?
-The script suggests that the rate of water removal during the first two hours is slower than the rate after the pump is repaired.
What is the purpose of the graph options provided in the script?
-The purpose of the graph options is to visually represent the different scenarios of water removal from the pool and to identify which graph best fits the described situation.
Which graph option is eliminated first based on the script's information?
-Graph A is eliminated first because it shows the pool being emptied in 10 hours, which contradicts the six-hour timeline mentioned in the script.
Why is Graph D not the correct depiction of the situation?
-Graph D is not correct because it shows a decrease in volume from zero to four hours, which is longer than the initial two-hour period when the pump was working slower.
What distinguishes Graph B from Graph C in terms of the rate of change?
-Graph B shows a less steep slope for the volume per time during the first two hours compared to the latter part, while Graph C maintains the same steepness throughout, which does not align with the script's description of a change in the pump's rate.
Why is Graph B considered the correct answer according to the script?
-Graph B is considered the correct answer because it depicts two different rates of change, with a slower rate for the first two hours and a faster rate after the pump is repaired, which matches the script's description of the situation.
What does the script imply about the importance of understanding the rate of change in the context of the problem?
-The script implies that understanding the rate of change is crucial for accurately depicting the situation and selecting the correct graph that represents the process of the pool being emptied.
Outlines
🏊♂️ Pool Pump Issue and Graph Analysis
The script describes a scenario where a swimming pool is being drained by a pump. Initially, the pump operates at a slower rate due to a broken piece, which lasts for the first two hours. After the piece is fixed, the pump works at its normal rate until the pool is empty. The entire process takes six hours. The task is to choose the correct graph that represents this situation, with time (T in hours) on the x-axis and the volume of water in gallons on the y-axis. The analysis involves eliminating graphs that do not match the described conditions, such as one showing the pool being emptied in 10 hours, and another showing a decrease in volume over the first four hours instead of just two. The correct graph must show two distinct rates of change: a slower rate for the first two hours and a normal rate for the remaining time until the pool is empty.
Mindmap
Keywords
💡Swimming Pool
💡Pump
💡Volume
💡Constant Rate
💡Broken Piece
💡Graph
💡Independent Variable
💡Dependent Variable
💡Slope
💡Rate of Change
💡Malfunction
Highlights
The figure depicts a swimming pool being emptied using a pump.
The pump's rate of water removal is constant when operating normally.
During the first two hours, the pump works slower due to a broken piece.
The pump stops working after the broken piece is identified.
The broken piece is replaced, allowing the pump to resume at its usual rate.
The entire process of emptying the pool takes six hours.
Graph A is eliminated as it contradicts the six-hour timeframe.
Graphs B, C, and D are potential candidates as they end at six hours.
Graph D is eliminated due to a decrease over the first four hours, not just two.
Graph B and C are considered due to their depiction of a change at two hours.
Graph C is eliminated because the rate of decrease remains constant, which contradicts the story.
Graph B is identified as the correct answer, showing two different rates of change.
The analysis focuses on the rate of water decrease and the impact of the broken pump.
The process involves a logical elimination of graph options based on the given scenario.
The final selection of the graph is based on the depiction of the pump's varying rates of operation.
The problem-solving approach emphasizes the importance of understanding the context and constraints of the scenario.
The transcript provides a clear example of how to analyze and interpret graphical data in relation to a real-world situation.
Transcripts
Browse More Related Video
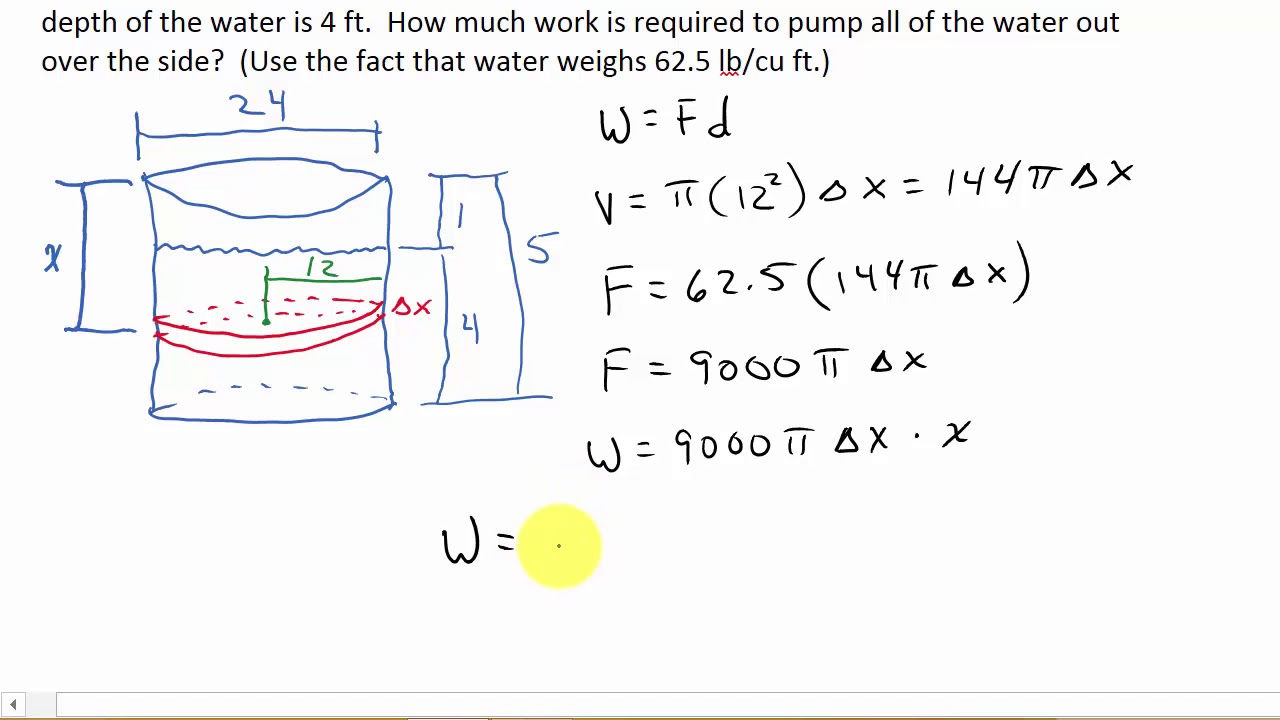
Calculus Work Pump Water From a Circular Swimming Pool

Exponential Growth and Decay Calculus Problem Solution | How To Find Relative Growth Rate
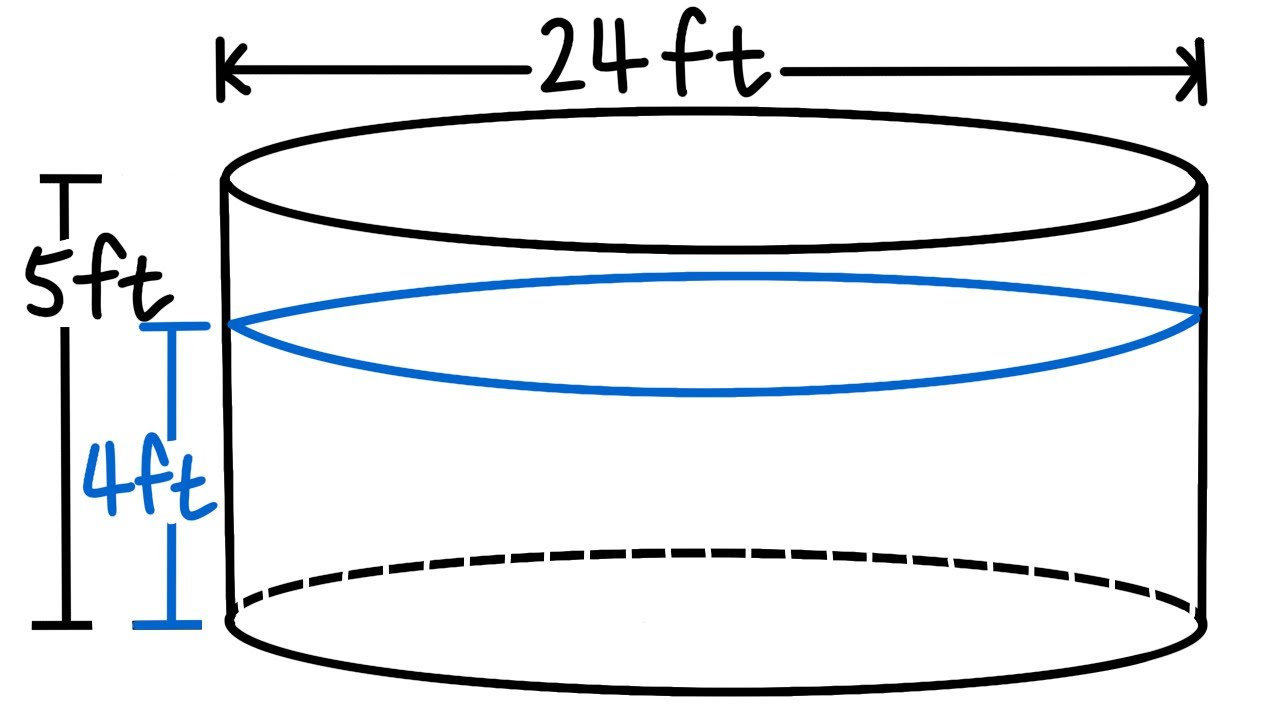
Calculating Work, pumping water out of a circular swimming pool

Pump and its types used in HPLC || High performance liquid chromatography || HPLC #chromatography
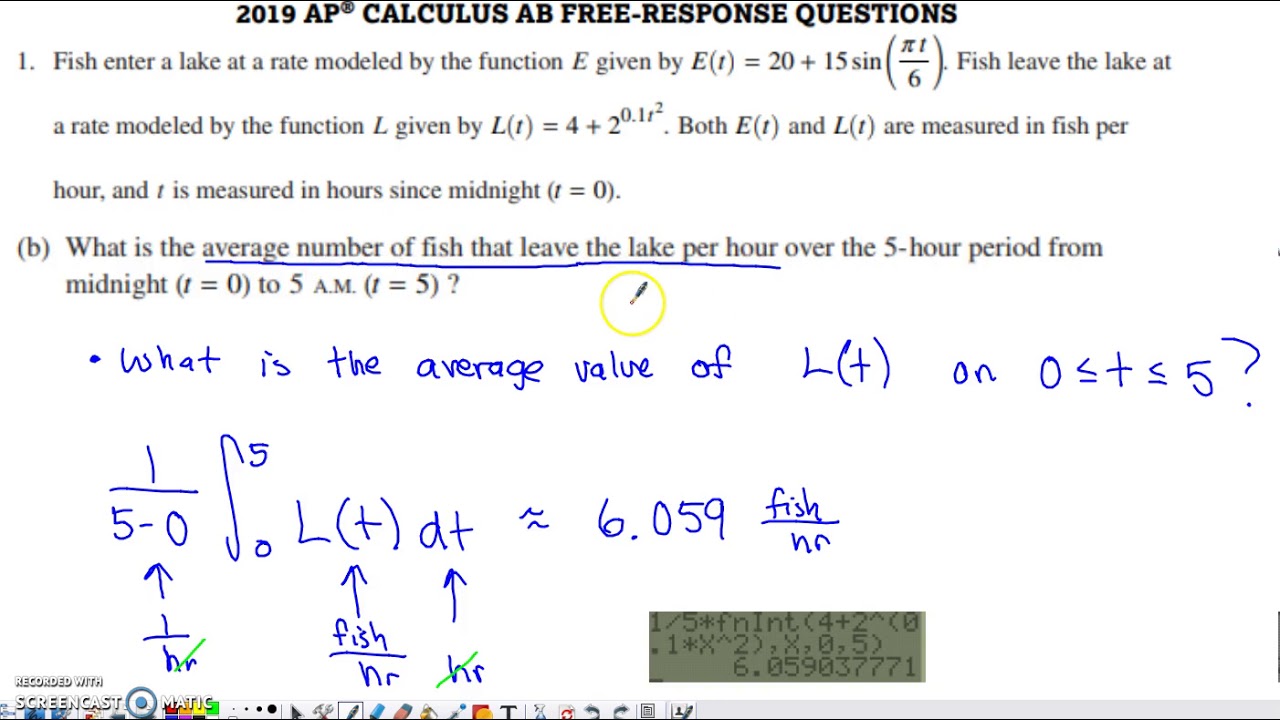
2019 AP Calculus AB & BC Free Response Question #1

2013 AP Calculus AB Free Response #1
5.0 / 5 (0 votes)
Thanks for rating: