2019 AP Calculus AB & BC Free Response Question #1
TLDRThe transcript describes a calculus problem involving fish entering and leaving a lake, with rates given by functions e(t) and L(t), respectively. The problem is divided into three parts: Part A asks for the total number of fish entering the lake over a five-hour period, which is solved by integrating e(t) from 0 to 5 hours, resulting in 153 fish. Part B seeks the average number of fish leaving per hour in the same timeframe, which is found by averaging the function L(t) over the interval, yielding an average of 6.059 fish per hour. Part C involves finding the time at which the lake has the maximum number of fish within an eight-hour interval. By defining a net rate of change function n(t) as the difference between the entry and exit rates, it's determined that the maximum occurs at t = 6.204 hours. Lastly, the problem inquires whether the rate of change in the number of fish is increasing or decreasing at t = 5 hours. By evaluating the derivative of n(t), it's concluded that the rate of change is decreasing at that time, with a negative derivative value of -10.7 fish per hour per hour.
Takeaways
- 🐟 The problem involves calculating the number of fish entering and leaving a lake, with rates given by functions e(t) and L(t) respectively.
- ⏱️ The time variable T is measured in hours since midnight, and rates are given in fish per hour.
- 📊 Part A asks for the total number of fish that entered the lake over a 5-hour period, which is found by integrating the rate function e(t) from 0 to 5 hours.
- 🔢 The answer to Part A is 153 fish, rounded to the nearest whole number, ensuring units are consistent throughout the calculation.
- 🏞️ Part B seeks the average number of fish leaving the lake per hour over the same 5-hour period, using the average value of the rate function L(t).
- 🧮 The average rate is calculated as 6.059 fish per hour, adhering to the AP standard of three digits beyond the decimal before rounding.
- 📈 Part C involves finding the time within an 8-hour interval when the number of fish in the lake is greatest, by analyzing the net rate of change function n(t).
- 📌 The maximum number of fish in the lake occurs at time T = 6.204 hours, as determined by the net rate of change function crossing zero.
- 📉 The rate of change of the number of fish in the lake is decreasing at time T = 5 hours, as indicated by the negative derivative of the net rate of change function.
- 📋 The process emphasizes the importance of unit consistency and the logical flow of calculations, from integration to differentiation.
- 📘 The use of a graphing calculator, such as a TI-83, is instrumental in performing the necessary mathematical operations and visualizing the functions.
Q & A
What is the context of the problem discussed in the transcript?
-The problem is from the 2019 AP Calculus AB and BC free response questions, specifically a question about the rate of fish entering and leaving a lake, modeled by functions e(t) and L(t) respectively, with t measured in hours since midnight.
What is asked in Part A of the problem?
-Part A asks for the total number of fish that entered the lake over a five-hour period from midnight to 5 a.m., with the answer to be given to the nearest whole number.
How is the total number of fish entering the lake calculated in Part A?
-The total number of fish entering the lake is calculated by integrating the rate function e(t) across the interval from time 0 to time 5.
What is the significance of ensuring the units are consistent when performing calculations?
-Consistent units ensure the mathematical operations are valid and the final result is meaningful and measurable in the correct units, which in this case is fish.
What does Part B of the problem require?
-Part B asks for the average number of fish that leave the lake per hour over the same five-hour period from midnight to 5 a.m.
How is the average value of a function calculated in Part B?
-The average value is calculated by integrating the function L(t) over the interval from time 0 to time 5 and then dividing by the length of the interval (5 hours).
What does the average value of L(t) represent in the context of the problem?
-The average value of L(t) represents the average rate at which fish leave the lake per hour over the specified time interval.
What is the focus of Part C of the problem?
-Part C focuses on determining the time within the interval from zero to eight hours at which the number of fish in the lake is the greatest.
How is the net rate of change function, n(t), defined in Part C?
-The net rate of change function, n(t), is defined as the rate at which fish enter the lake (e(t)) minus the rate at which fish leave the lake (L(t)).
What does the sign of n(t) indicate about the number of fish in the lake?
-If n(t) is positive, the number of fish in the lake is increasing; if n(t) is negative, the number of fish is decreasing.
How is the time at which the maximum number of fish is in the lake determined?
-The time at which the maximum number of fish is in the lake is determined by finding when the net rate of change function n(t) equals zero within the interval from zero to eight hours.
What is asked in the final part of the problem regarding the rate of change at time five?
-The final part asks whether the rate of change in the number of fish in the lake is increasing or decreasing at time five, which involves evaluating the derivative of the net rate of change function n(t) at t=5.
What does the sign of the derivative of n(t) at time five indicate?
-If the derivative of n(t) at time five is negative, it indicates that the rate of change in the number of fish in the lake is decreasing at that time.
Outlines
📊 Calculating Fish Entry Over Time
The first paragraph discusses a problem from the 2019 AP Calculus AB and BC free response questions, specifically a question about fish entering and leaving a lake. The rate at which fish enter and leave the lake is given by functions e(t) and L(t) respectively, measured in fish per hour, with time T measured in hours since midnight. The task in Part A is to calculate the total number of fish that entered the lake over a five-hour period from midnight to 5 a.m. This is done by integrating the rate of fish entry across the given time interval. The solution involves using a calculator in Radian mode and yields an answer of 153 fish, rounded to the nearest whole number. The units of fish per hour are maintained throughout the calculation, ensuring the final result is in fish. Part B asks for the average number of fish leaving the lake per hour over the same period. This requires finding the average value of L(t) from time 0 to time 5, resulting in 6.059 fish per hour, following the AP standard of three digits beyond the decimal before rounding.
📈 Determining Peak Fish Population
The second paragraph continues the AP Calculus problem, focusing on the time interval from zero to eight hours. The goal is to find the time T when the number of fish in the lake is at its greatest. To solve this, a net rate of change function n(T) is defined, representing the difference between the rate of fish entering and leaving the lake. The sign of n(T) indicates whether the fish population is increasing or decreasing. By graphing n(T) and analyzing its behavior, it's determined that the fish population increases from time zero to approximately 6.204 hours, after which it decreases until time eight. This suggests that the maximum number of fish in the lake occurs at 6.204 hours. The paragraph concludes with an inquiry about the rate of change in the fish population at time five. The derivative of n(T), representing the rate of change of the rate of change, is evaluated at time five. The result is a negative value, indicating that the rate of change in the number of fish in the lake is decreasing at that time.
Mindmap
Keywords
💡AP Calculus
💡Free-response questions
💡Integration
💡Average value
💡
💡Net rate of change
💡Derivative
💡Radian mode
💡Units of measurement
💡Maximum value
💡Graphical representation
💡Second derivative
Highlights
The problem involves modeling the rate at which fish enter and leave a lake, with rates given by functions e(t) and L(t) respectively.
Part A asks for the total number of fish that entered the lake over a five-hour period from midnight to 5 a.m.
Integration of the rate function e(t) from 0 to 5 hours is used to find the total number of fish entering the lake.
The answer to Part A is rounded to the nearest whole number, resulting in 153 fish.
Units of fish per hour are confirmed for the rate of change, ensuring the calculation's accuracy.
Part B seeks the average number of fish leaving the lake per hour over the same five-hour period.
The average value of L(t) on the interval from 0 to 5 is calculated to determine the average rate of fish leaving.
The units for the average rate calculation are fish per hour, aligning with the question's requirements.
The result for Part B is 6.059 fish per hour, following the AP standard of three digits beyond the decimal.
Part C involves finding the time within an eight-hour interval when the number of fish in the lake is greatest.
A net rate of change function n(t) is defined to represent the difference between the rates of fish entering and leaving.
Graphing the net rate of change function helps identify when the number of fish in the lake is increasing or decreasing.
The maximum number of fish in the lake is determined to be at time t = 6.204 hours.
The rate of change in the number of fish in the lake is analyzed for time t = 5 hours.
The derivative of the net rate of change function n(t) is evaluated at t = 5, indicating a decreasing rate of change.
The derivative result of -10.7 fish per hour per hour confirms that the rate of change is decreasing at time five.
The problem-solving approach involves understanding and applying calculus concepts to real-world scenarios.
Accuracy in unit conversion and understanding the physical meaning behind mathematical operations is emphasized.
The use of a graphing calculator like the TI-83 is instrumental in solving the problem and visualizing the functions.
Transcripts
Browse More Related Video
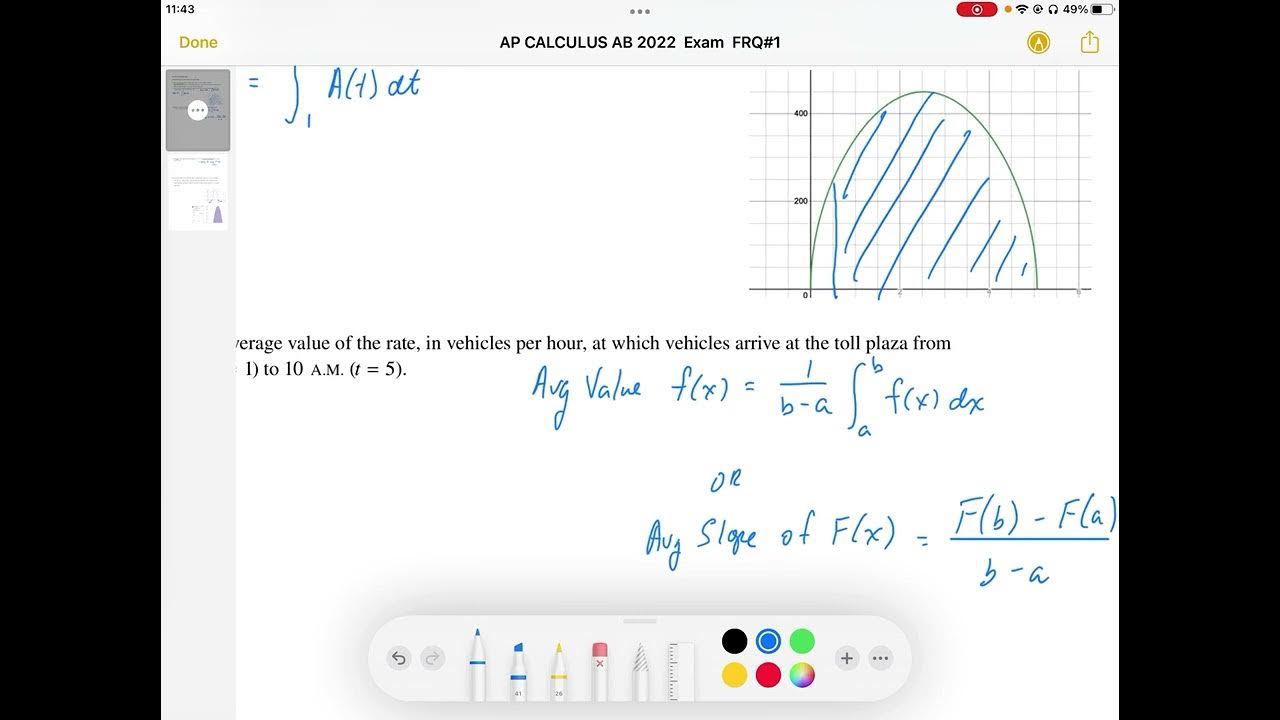
2022 AP Calculus AB & AP Calculus BC Exam FRQ #1
AP CALCULUS AB 2022 Exam Full Solution FRQ#1(a,b)

2006 AP Calculus AB Free Response #2
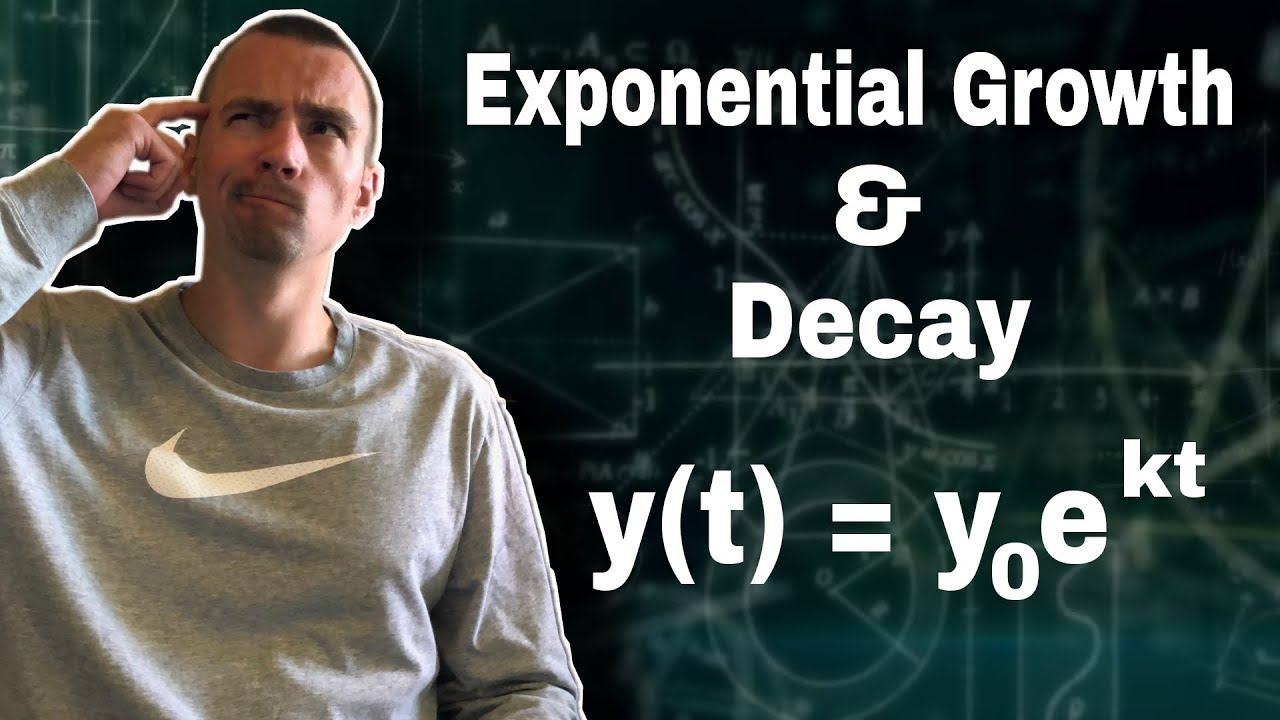
Exponential Growth and Decay Calculus Problem Solution | How To Find Relative Growth Rate
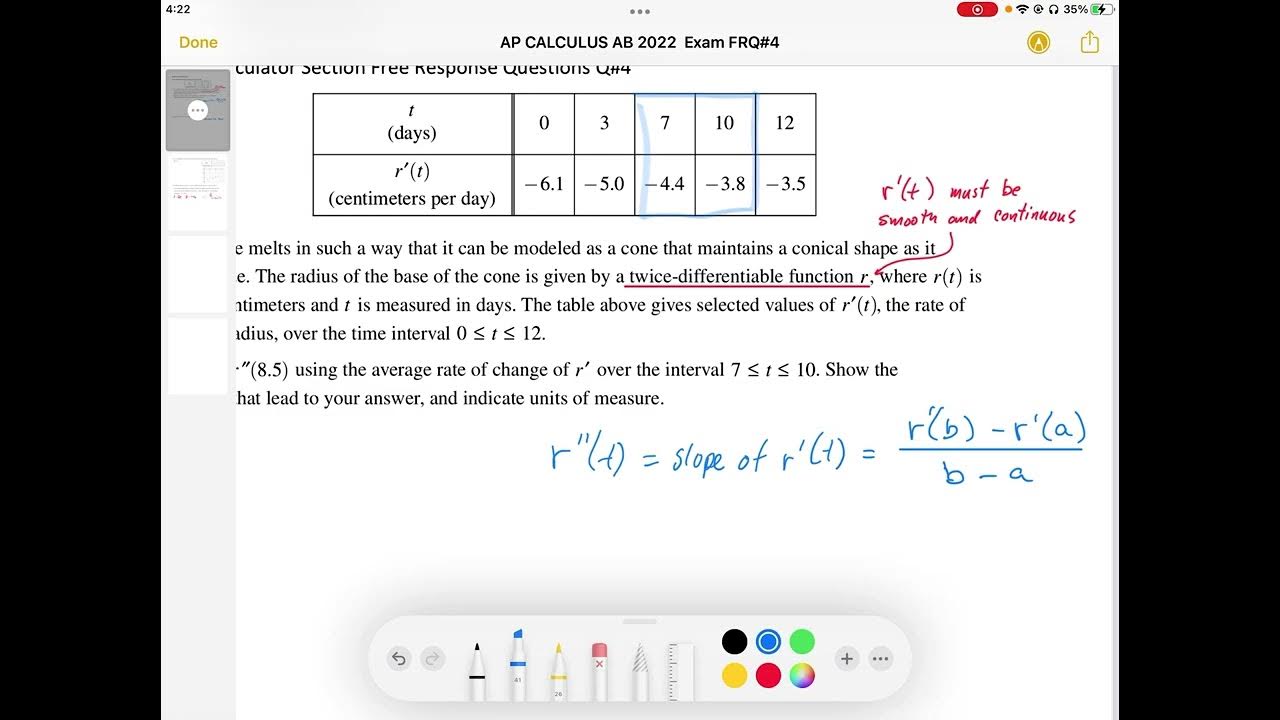
AP CALCULUS AB 2022 Exam Full Solution FRQ#4(a,b)
2004 AP Calculus AB Free Response #1
5.0 / 5 (0 votes)
Thanks for rating: