Confidence Interval And Hypothesis Testing | Statistics Tutorial For Beginners | Simplilearn
TLDRThis video from Simply Learn explores the fundamentals of mathematics and statistics in data science, focusing on confidence intervals and hypothesis testing. It explains the importance of point and interval estimation, the calculation of confidence intervals, and the significance of hypothesis testing in validating research claims. The tutorial covers the formulation of research questions, hypotheses, and the use of statistical tests like t-tests, z-tests, and f-tests, providing practical examples to clarify these concepts.
Takeaways
- 📚 Mathematics and statistics are fundamental to data science, forming the basis of machine learning algorithms and covering aspects like shapes, patterns, colors, and algorithms.
- 🔍 Two main types of estimates are discussed: point estimates, which are single value estimates, and interval estimates, which provide a range of possible values for a parameter.
- 📊 A confidence interval is a common interval estimate that represents the range within which a population parameter is likely to lie, with 95% and 99% being the most frequently used confidence levels.
- 🎯 The level of confidence is the probability that the true population parameter is within the confidence interval, denoted by 1 minus alpha, with alpha representing the likelihood of the parameter being outside the interval.
- ⚖️ The margin of error in interval estimation is calculated by adding and subtracting it from the point estimate, which helps to understand the precision of the estimate.
- 🌡️ An example is given where a student calculates a 95% confidence interval for the boiling temperature of a liquid, demonstrating the practical application of interval estimation.
- 🧐 Hypothesis testing is introduced as a method for testing claims about a population parameter using sample data, with the goal of determining if there is sufficient statistical evidence to support the hypothesis.
- 📝 The difference between a research question and a hypothesis is highlighted, with the hypothesis making predictions about outcomes and the research question identifying areas of investigation.
- 🚫 The null hypothesis is defined as the assumption that an event will not occur and serves as a benchmark against which the alternative hypothesis is tested.
- 🔄 The test statistics in hypothesis testing summarize the observed data into a single number, which is compared against the expected distribution under the null hypothesis.
- 📉 Three common statistical tests are mentioned: the t-test for comparing group means, the z-test for comparing a sample mean to a population mean when population variance is known or sample size is large, and the f-test for assessing the equality of variances or the effect of treatments in ANOVA.
Q & A
What is the main focus of the video 'Simply Learn: Maths and Statistics for Data Science'?
-The video focuses on the importance of mathematics and statistics in data science, particularly in relation to machine learning algorithms. It discusses confidence intervals and hypothesis testing, explaining their applications and calculations.
What is the difference between a point estimate and an interval estimate in statistics?
-A point estimate is a single value estimate of a parameter, such as the sample mean which is an estimate of the population mean. An interval estimate, on the other hand, provides a range of values within which the parameter is expected to lie, such as a confidence interval.
What does a 95% confidence interval imply about the population parameter?
-A 95% confidence interval implies that we are 95% certain that the true population parameter lies within the calculated range of values. It is a range expressed as a percentage that is expected to contain the best estimate of a statistical parameter.
What is the significance of the alpha level in the context of confidence intervals?
-The alpha level represents the likelihood that the true population parameter lies outside the confidence interval. It is denoted by 1 minus the confidence level, and it is commonly expressed as a proportion, such as 0.05 for a 95% confidence level.
How is the margin of error calculated in the context of interval estimates?
-The margin of error is calculated by multiplying the z-score (which corresponds to the desired confidence level) by the standard deviation and then dividing by the square root of the sample size (z * (s / √n)).
Can you provide an example of how to calculate a 95% confidence interval for a sample mean?
-Sure. Given a sample mean (x̄), a standard deviation (s), and a sample size (n), the 95% confidence interval can be calculated using the formula x̄ ± z * (s / √n), where z is the z-score for a 95% confidence level, typically 1.96.
What is hypothesis testing, and why is it used in research?
-Hypothesis testing is a method for testing a claim or hypothesis about a population parameter using data from a sample. It is used to determine whether there is enough statistical evidence to support the hypothesis, thus helping to validate or refute the claim.
What is the difference between a research question and a hypothesis in a study?
-A research question is a broad issue or specific concern that the research aims to address, whereas a hypothesis is a testable prediction about the expected outcomes of the study. The hypothesis is derived from the research question and makes a specific prediction about the relationship between variables.
What are the key components of a good hypothesis?
-A good hypothesis should be compatible with current knowledge, logically consistent, clearly stated, and testable. It should not be vague or inconsistent and should provide a clear prediction that can be empirically tested.
Can you explain the difference between a null hypothesis and an alternative hypothesis?
-The null hypothesis (H₀) is an assumption that there is no effect or relationship between variables, and it is what is tested against. The alternative hypothesis (H₁) is the logical opposite of the null hypothesis and represents the research hypothesis, suggesting an effect or relationship that the researcher is trying to prove.
What are the three main types of statistical tests mentioned in the video, and what are they used for?
-The three main types of statistical tests mentioned are the t-test, which is used to compare the means of two groups; the z-test, used for comparing a sample mean to a population mean when the population variance is known or the sample size is large; and the F-test, which is used to assess the equality of variances or to test for differences between group means in an ANOVA context.
What is the significance level in hypothesis testing, and how is it used to make a decision about the null hypothesis?
-The significance level, often denoted by alpha, is the probability threshold used to decide whether to reject the null hypothesis. If the probability of obtaining the observed data is less than the significance level, the null hypothesis is rejected. Commonly used levels include 0.05 or 0.01.
Outlines
📚 Introduction to Statistics for Data Science
The video begins by emphasizing the importance of mathematics and statistics in data science, highlighting their foundational role in machine learning algorithms. The speaker introduces two key statistical concepts: confidence intervals and hypothesis testing, explaining their applications in real-life scenarios. A confidence interval is defined as a range of values within which a parameter is likely to lie, with the most common levels being 95% and 99%. The concept of 'alpha' is introduced as the probability that the true population parameter lies outside the confidence interval, with the level of confidence being 1 minus alpha. The video also explains how to calculate interval estimates and margin of error, using a boiling point example to illustrate the process.
🔍 Hypothesis Testing and Research Methodology
This paragraph delves into hypothesis testing, a method used to evaluate claims about population parameters based on sample data. The speaker outlines the process of formulating a research question and hypothesis, clarifying the difference between the two. A hypothesis is a testable prediction about the relationship between variables, whereas a research question is a broader inquiry. The video also distinguishes between the null hypothesis (assuming no effect or relationship) and the alternative hypothesis (positing an effect or relationship). Criteria for a good hypothesis are discussed, emphasizing testability and consistency with existing knowledge. The paragraph concludes with an overview of statistical tests, including t-tests, z-tests, and f-tests, which are used to compare group means and variances in hypothesis testing.
📘 Understanding Hypothesis Testing with Examples
The final paragraph provides a practical understanding of hypothesis testing through an example involving the impact of online science learning videos on student scores. It introduces the concept of the significance level, which is the probability threshold for rejecting the null hypothesis. The significance level is commonly set at 0.05, indicating a 5% risk of concluding an effect when none exists. If the study's result shows a probability lower than this threshold, the null hypothesis is rejected, suggesting an effect or relationship. Conversely, a higher probability supports the null hypothesis. The video concludes with an invitation for viewers to ask questions in the comments and to subscribe for more educational content.
Mindmap
Keywords
💡Data Science
💡Machine Learning Algorithms
💡Confidence Interval
💡Hypothesis Testing
💡Point Estimate
💡Interval Estimate
💡Level of Confidence
💡Alpha
💡Margin of Error
💡Null Hypothesis
💡Alternative Hypothesis
💡Research Question
💡Significance Level
Highlights
Mathematics and statistics are fundamental to machine learning algorithms, influencing everything from shapes, patterns, colors to algorithms.
Confidence intervals and hypothesis testing are two key statistical concepts with practical applications in real-life scenarios.
Point estimate and interval estimate are two types of estimates used to understand population parameters, with the sample mean being an example of a point estimate.
A confidence interval provides a range of values within which a parameter is expected to lie, commonly expressed as percentages like 95% or 99%.
The level of confidence, represented by 1 minus alpha, indicates the likelihood that the true population parameter lies within the confidence interval.
The margin of error in interval estimation helps understand the closeness of a point estimate to the parameter value.
The formula for calculating interval estimates involves the sample mean, z-score, standard deviation, and sample size.
An example demonstrates calculating a 95% confidence interval for the mean boiling temperature of a liquid.
Hypothesis testing is a method to evaluate claims about population parameters using sample data.
A research question is distinct from a hypothesis; the former identifies a problem, while the latter predicts an outcome.
A hypothesis is a testable prediction about expected outcomes in a study, often beginning with a question and supported by background research.
Criteria for a good hypothesis include compatibility with current knowledge, logical consistency, clarity, and testability.
The null hypothesis assumes no effect or relationship, serving as a baseline that is rejected in favor of the alternative hypothesis if evidence supports it.
Test statistics summarize observed data into a single number to compare against the expected distribution under the null hypothesis.
T-tests, Z-tests, and F-tests are common statistical tests used to compare group means, assess variances, and evaluate hypotheses.
An example of hypothesis testing involves evaluating the impact of special science learning videos on student scores.
The significance level, often set at 0.05, determines the probability threshold for rejecting the null hypothesis based on study results.
The tutorial concludes with an invitation for questions and an encouragement to subscribe for more educational content.
Transcripts
Browse More Related Video
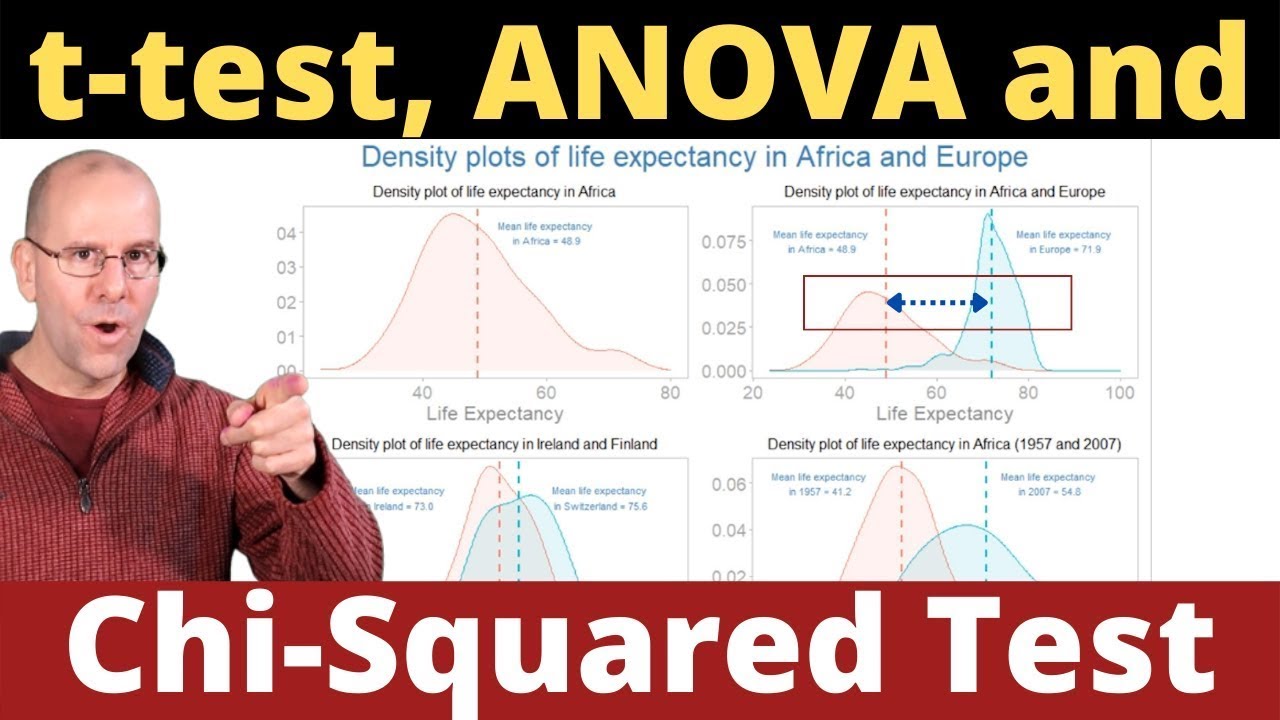
T-test, ANOVA and Chi Squared test made easy.
Elementary Statistics Chapter 8 - Introduction Hypothesis Testing Part 1 Lesson 1

Elementary Stats Lesson #20
Math 119 Chapter 9 part 3
AP Statistics 10-Minute Recap
One-Sample t Test & Confidence Interval in R with Example | R Tutorial 4.1| MarinStatsLectures
5.0 / 5 (0 votes)
Thanks for rating: