T-test, ANOVA and Chi Squared test made easy.
TLDRThis informative video delves into the world of statistical tests, explaining when and how to use them effectively. It covers the T-test, ANOVA, and Chi-squared tests, providing clear examples for each. The video emphasizes understanding the research question to select appropriate tests and interpret results. It explains hypothesis testing, the concept of statistical significance, and how to draw conclusions from data using p-values and confidence intervals. The content is presented in a straightforward manner, making complex statistical concepts accessible to viewers.
Takeaways
- 📊 Understanding statistical tests begins with identifying the research question, which simplifies interpreting results and deciding which tests to use.
- 🧪 The T-test is used to compare means or averages, with four types discussed: single sample, two-tailed, one-tailed, and paired.
- 🌍 Real-world examples, such as life expectancy in Africa, illustrate the application of the T-test and hypothesis testing for statistical significance.
- 🔄 The null hypothesis assumes no difference in means between populations; if the observed data makes this unlikely, it can be rejected for a statistically significant result.
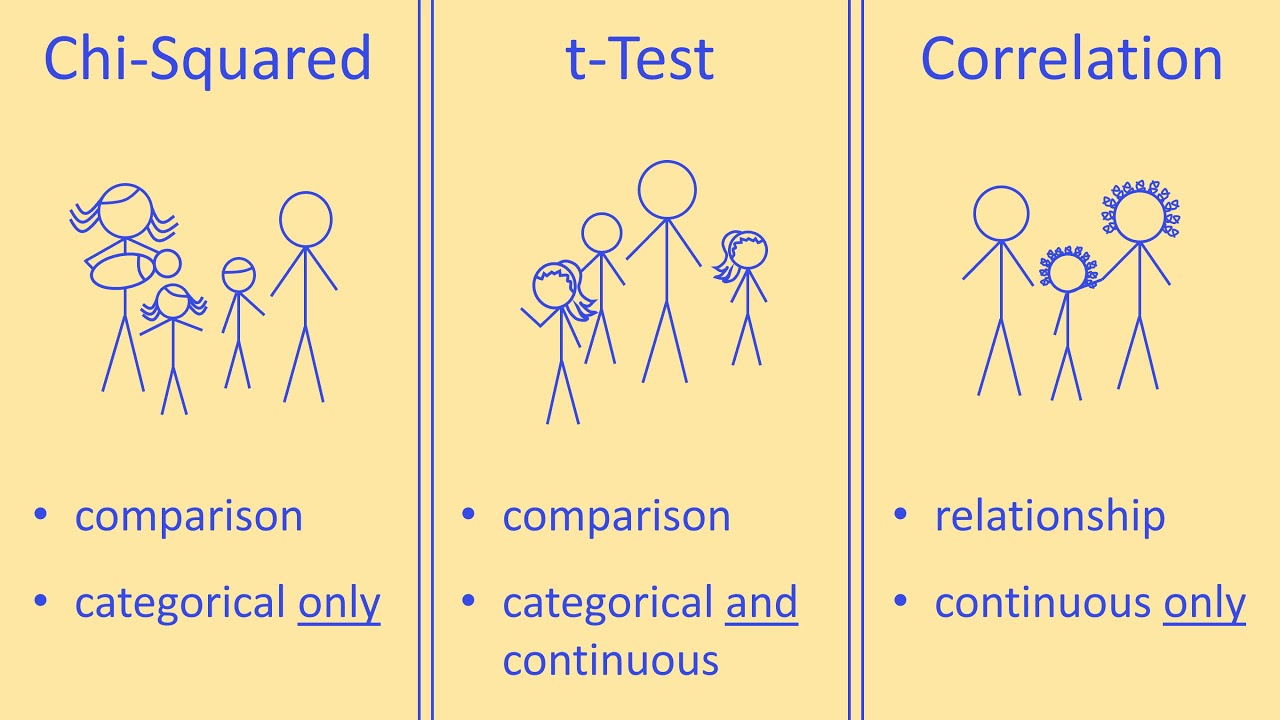
- 🔢 For the Chi-squared test, there are two main types: Goodness of Fit and Test of Independence, which analyze categorical variables and their proportions.
- 📈 ANOVA (Analysis of Variance) is used when comparing three or more populations' means, with the null hypothesis being no difference among them.
- 🔎 After a significant ANOVA result, further analysis, like multiple comparison tests, can pinpoint which population means are different from each other.
- 🌼 The Chi-squared Goodness of Fit test determines if observed proportions in categories significantly differ from expected proportions.
- 🔗 The Chi-squared Test of Independence assesses if there's a relationship between categorical variables, beyond what would be expected by chance.
- 🎯 The p-value is crucial in hypothesis testing; if it's below the predetermined threshold (commonly 5%), the null hypothesis is rejected, indicating statistical significance.
- 📚 Understanding these statistical tests and their applications empowers researchers to make informed conclusions from their data.
Q & A
What is the primary focus of the video?
-The video focuses on explaining statistical tests, specifically when to use the t-test, ANOVA, and chi-squared test, and how to interpret their results in the context of global health data.
What are the different types of t-tests discussed in the video?
-The video discusses four types of t-tests: single sample t-test, two-tailed t-test, one-tailed t-test, and paired t-test.
What is the null hypothesis in statistical testing?
-The null hypothesis is an assumption that there is no difference or effect. It is the default assumption that is tested against the alternative hypothesis, and it is typically rejected if the observed data is unlikely under the null hypothesis.
How is the decision made to reject or accept the null hypothesis?
-The decision to reject or accept the null hypothesis is based on the p-value. If the p-value is less than a predetermined threshold (commonly 5%), the null hypothesis is rejected, indicating that the observed effect is statistically significant.
What is the difference between a one-tailed and a two-tailed t-test?
-A one-tailed t-test is used when the research question specifies a direction for the expected difference (e.g., is life expectancy in Africa less than in Europe?). A two-tailed t-test is used when the research question is about the presence of any difference, regardless of direction (e.g., is life expectancy in Ireland different from Switzerland?).
What is ANOVA and when is it used?
-ANOVA (Analysis of Variance) is a statistical test used when comparing the means of three or more populations. It tests whether there are any statistically significant differences between the means of these populations.
What does a chi-squared test measure?
-A chi-squared test measures whether there is a significant difference in the proportions of categorical variables across different categories (goodness of fit) or whether the proportions are independent of each other (test of independence).
How does the chi-squared test of independence help in understanding relationships between variables?
-The chi-squared test of independence helps determine if there is a statistically significant relationship between two categorical variables. If the p-value is very small, it suggests that knowing the value of one variable provides information about the probability of the other variable, indicating a relationship between them.
What is the significance of the p-value in hypothesis testing?
-The p-value represents the probability of observing the data or something more extreme if the null hypothesis were true. A small p-value (typically less than 0.05) indicates that the observed results are unlikely under the null hypothesis, leading to its rejection in favor of the alternative hypothesis.
How can multiple comparison tests be used after ANOVA?
-After conducting an ANOVA and finding a statistically significant difference among group means, multiple comparison tests can be used to determine which specific groups differ from each other. These tests adjust the p-values to control for the increased risk of Type I error due to multiple comparisons.
What is the importance of hypothesis testing in global health research?
-Hypothesis testing is crucial in global health research as it allows researchers to determine whether observed health trends and differences between populations are statistically significant, thereby providing evidence for health interventions and policies.
Outlines
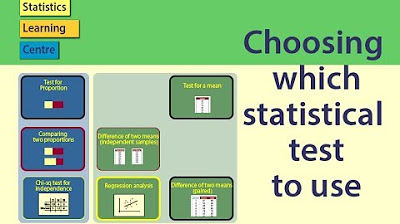
📊 Introduction to Statistical Tests
This paragraph introduces the topic of statistical tests, emphasizing the importance of understanding the question being asked. It outlines that the video will cover three main statistical tests: the t-test, ANOVA (Analysis of Variance), and the chi-squared test. The t-test section will delve into single sample, two-tailed, one-tailed, and paired tests, while the chi-squared test will include goodness of fit and test of independence. The speaker assures viewers that these concepts will be easy to understand and apply.
🧠 Understanding the T-Test
The speaker explains the concept of the t-test in detail, using real data and examples. It covers four different scenarios of the t-test, including single sample, two-tailed, one-tailed, and paired tests. The explanation includes the process of hypothesis testing, where the null hypothesis assumes no difference in means between populations. The significance of the p-value in determining statistical significance is highlighted, with a focus on the 5% threshold for rejecting the null hypothesis.
📈 Analysis of Variance (ANOVA)
This section introduces ANOVA, a statistical method used to compare the means of three or more populations. The null hypothesis in ANOVA is that there are no differences in the means, while the alternative hypothesis suggests there is a difference. The speaker uses box plots and density plots to illustrate differences in means across populations. The process of rejecting the null hypothesis if the p-value is less than a predetermined threshold is explained, along with the use of multiple comparison tests to identify which population means differ significantly.
📊 Chi-Squared Tests: Goodness of Fit and Independence
The final paragraph discusses the chi-squared tests, focusing on the goodness of fit and the test of independence. The goodness of fit test is used to determine if there is a difference in the proportions of categorical variables, while the test of independence assesses whether the proportions are dependent on or independent of another variable. The speaker explains the hypothesis testing process for these tests, emphasizing the significance of the p-value in determining statistical significance. The explanation includes the concept of the alpha value and how it is used to establish the threshold for statistical significance.
Mindmap
Keywords
💡Statistical tests
💡Hypothesis testing
💡t-test
💡ANOVA (Analysis of Variance)
💡Chi-squared test
💡P-value
💡Null hypothesis
💡Alternative hypothesis
💡One-tailed and two-tailed tests
💡Goodness of fit
💡Test of independence
Highlights
The video discusses statistical tests and when to use them, emphasizing the importance of understanding the question being asked.
Three main statistical tests are covered: the t-test, ANOVA (Analysis of Variance), and the chi-squared test.
The t-test is used to analyze the difference in means or averages between populations or over time.
The null hypothesis in statistical testing assumes no difference in means between populations.
A p-value is used to determine statistical significance, with a common threshold of 5%.
The video provides real-world examples using life expectancy data from different regions.
Single sample, two-tailed, one-tailed, and paired t-tests are explained with applications.
ANOVA is introduced as a method to compare three or more populations' means.
Box plots and density plots are used to illustrate differences in means across populations in ANOVA.
The chi-squared test is discussed for analyzing categorical variables and their proportions.
The goodness of fit and test of independence are two types of chi-squared tests explained.
Hypothesis testing involves assuming the null hypothesis and determining the likelihood of observing the sample data.
The video emphasizes the importance of not engaging in p-hacking and pre-determining the threshold for statistical significance.
The presenter uses the iris flower dataset to demonstrate the chi-squared test of independence.
The video concludes by encouraging viewers to watch more, share, subscribe, and engage with the content.
Transcripts
Browse More Related Video
Statistical Tests: Choosing which statistical test to use

Confidence Interval And Hypothesis Testing | Statistics Tutorial For Beginners | Simplilearn

t-Test - Full Course - Everything you need to know
Choosing a Statistical Test for Your IB Biology IA

T-Tests: A Matched Pair Made in Heaven: Crash Course Statistics #27

Statistics made easy ! ! ! Learn about the t-test, the chi square test, the p value and more
5.0 / 5 (0 votes)
Thanks for rating: