Three Different t tests using SPSS with Dr Ami Gates
TLDRThis video tutorial with Dr. Amy Gates introduces three types of T-tests: independent samples, one-sample, and paired samples. Using SPSS, the video demonstrates how to compare sample means, test against a known population mean, and analyze paired data like pre- and post-test scores. The examples include determining if male and female heights differ significantly, comparing a sample mean to a population mean, and assessing changes from pre- to post-tests. The tutorial also explains how to interpret SPSS results, including T-values and P-values, to make statistical conclusions.
Takeaways
- 📚 The video is a tutorial on performing three types of T-tests in SPSS, focusing on statistical analysis of sample means.
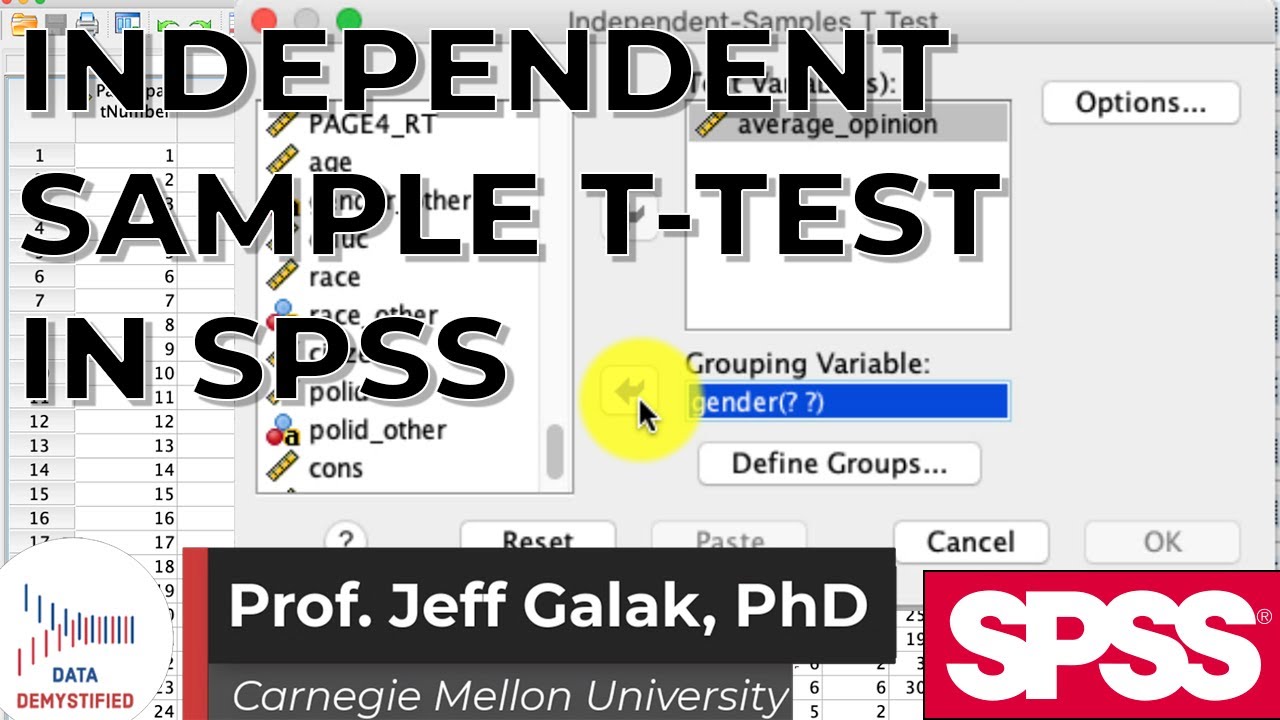
- 🔍 The first type discussed is the Independent Samples T-Test, used to compare the means of two independent groups, such as male and female heights in the given example.
- ⚖️ The null hypothesis for the Independent Samples T-Test is that there is no significant difference between the two sample means, with an alternative hypothesis that there is a significant difference.
- 📊 The video demonstrates how to set up and interpret the results of an Independent Samples T-Test in SPSS, including determining equal variances using an F-test.
- 📉 The second type of T-test covered is the One Sample T-Test, which compares a sample mean to a known population mean, exemplified by comparing the sample height to a global average height.
- 🌐 The One Sample T-Test does not require assumptions about equal variances, simplifying the analysis process in SPSS.
- 📝 The third type of T-test is the Paired Samples T-Test, used for paired data such as pre-test and post-test scores from the same individuals.
- 🔑 The Paired Samples T-Test is set up in SPSS by identifying the two paired variables, such as pre-test and post-test scores, and analyzing their means.
- 📉 The video script provides a step-by-step guide on how to input data and interpret the results for each T-test type in SPSS.
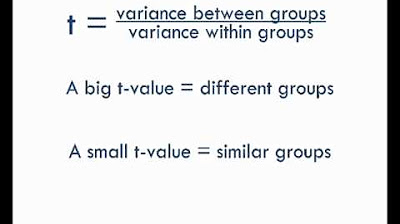
- 📊 The results of the T-tests are interpreted based on the P-value and the T-value, determining whether to reject or fail to reject the null hypothesis.
- 📈 The video concludes with a clear explanation of how to understand the significance of the differences between sample means and population means using T-tests in SPSS.
Q & A
What is the main focus of the video script?
-The video script focuses on explaining three types of T-tests that can be used in statistical analysis, specifically in the context of SPSS software.
What is an independent samples T-test?
-An independent samples T-test is used to compare two sample means to determine if they are significantly different from each other, assuming the samples are independent of each other.
What is the null hypothesis for the independent samples T-test in the script's example?
-The null hypothesis for the independent samples T-test in the example is that the mean heights of males and females are not significantly different.
What statistical software is used in the video script to demonstrate the T-tests?
-The statistical software used in the video script to demonstrate the T-tests is SPSS.
What is the significance of the alpha value of 0.05 in the context of T-tests?
-The alpha value of 0.05 is used as the threshold for statistical significance in the T-tests. If the P-value is less than 0.05, the null hypothesis is rejected.
What is a one-sample T-test and how is it different from an independent samples T-test?
-A one-sample T-test is used to compare a single sample mean to a known population mean, whereas an independent samples T-test compares the means of two different, independent samples.
What is the purpose of the F test in the context of T-tests?
-The F test is used to determine whether to assume equal variances when performing a T-test. It provides a P-value that helps decide if the variances are equal or not.
What is a paired samples T-test and what kind of data does it analyze?
-A paired samples T-test is used to compare two related or dependent samples, such as pre-test and post-test scores from the same individuals, to see if there is a significant difference between them.
How does the script demonstrate the process of conducting a T-test in SPSS?
-The script demonstrates the process by guiding through the SPSS menu options, explaining how to select the type of T-test, define groups, and interpret the results based on the output provided by SPSS.
What is the conclusion of the paired samples T-test example in the script?
-The conclusion of the paired samples T-test example is that there is a significant difference between the pre-test and post-test scores, as indicated by a very small P-value.
Outlines
📊 Independent Sample T-Test in SPSS
The first paragraph introduces the concept of an independent sample t-test, focusing on comparing two sample means to determine if they are significantly different. The example provided involves analyzing the mean height of males and females in a sample to see if there is a significant difference. The null hypothesis is that there is no significant difference, while the alternative hypothesis suggests there is. The test is two-tailed with an alpha level of 0.05. The process of conducting this test in SPSS is explained, including how to group data by gender and interpret the results, which include determining whether to assume equal variances based on an F-test and ultimately assessing the statistical significance of the difference in means.
📈 One Sample T-Test: Comparing Sample to Population Mean
The second paragraph discusses the one sample t-test, which is used to compare a sample mean to a known population mean. The goal is to assess whether the sample mean significantly differs from the population mean. The null hypothesis posits no significant difference, while the alternative hypothesis indicates a significant difference. Using an example where the known population mean height is 62 inches, the process of conducting this test in SPSS is described. This includes selecting the one sample t-test option, inputting the known population mean, and analyzing the sample mean of heights from the dataset. The results are interpreted to determine if the sample mean is significantly different from the population mean, with a focus on the P-value and its comparison to the alpha level of 0.05.
🔬 Paired Sample T-Test: Pre-Post Analysis in SPSS
The final paragraph covers the paired sample t-test, which is used to compare paired observations, such as pre-test and post-test scores, to see if there is a significant difference. The example given involves analyzing whether there is a significant change in test scores from pre to post. The null hypothesis suggests no significant difference between the means, while the alternative hypothesis claims there is. The process of conducting this test in SPSS is outlined, including selecting the paired samples t-test option and identifying the paired variables. The results are then interpreted, with a focus on the T-value and P-value, to determine if there is a statistically significant difference between the pre-test and post-test scores.
Mindmap
Keywords
💡Statistics
💡Independent Sample T-Test
💡Null Hypothesis
💡Alternative Hypothesis
💡Alpha (α)
💡SPSS
💡One-Sample T-Test
💡Paired Sample T-Test
💡Significance Level
💡P-Value
💡Variance
Highlights
Introduction to learning statistics with Dr. Amig Gates focusing on three types of T-tests.
Explanation of the Independent Sample Means T-Test and its application in comparing two sample means.
Use of SPSS for conducting the Independent Sample Means T-Test with a two-tailed test and an alpha of 0.05.
Null hypothesis states no significant difference in mean heights between males and females.
Alternative hypothesis posits a significant difference in mean heights between genders.
Demonstration of grouping by gender in SPSS to compare mean heights.
Identification of potential data set errors and their impact on analysis.
Steps to perform an Independent Samples T-Test in SPSS, including selecting the correct variables and groups.
Interpretation of SPSS results, including the decision to assume equal variances based on the F-test P-value.
Determination of statistical significance in height difference between genders using T-test values and P-values.
Introduction to the One Sample T-Test for comparing a sample mean to a known population mean.
Null hypothesis of no difference between the sample and the known population mean height of 62 inches.
Procedure to conduct a One Sample T-Test in SPSS, including setting the test value and selecting the test variable.
Analysis of One Sample T-Test results, emphasizing the closeness of the sample mean to the population mean.
Introduction to the Paired Sample T-Test for comparing paired data such as pre-test and post-test scores.
Null hypothesis of no difference between pre-test and post-test sample means.
Alternative hypothesis suggesting a significant difference between pre-test and post-test means.
Execution of a Paired Samples T-Test in SPSS, defining the paired variables for comparison.
Interpretation of Paired Samples T-Test results, identifying a significant difference between pre-test and post-test scores.
Summary of the three T-tests, their applications, and how to interpret the results in SPSS.
Transcripts
Browse More Related Video

SPSS (9): Mean Comparison Tests | T-tests, ANOVA & Post-Hoc tests
One sample t-test vs Independent t-test vs Paired t-test

t-Test - Full Course - Everything you need to know
StatsCast: What is a t-test?

Elementary Stats Lesson # 21
Independent Sample t-Test in SPSS Tutorial (SPSS Tutorial Video #13) - Comparing Two Groups
5.0 / 5 (0 votes)
Thanks for rating: