Statistics 101: Two-way ANOVA w/o Replication, The Calculation
TLDRThis video tutorial offers an in-depth guide on conducting a two-way block ANOVA without replication, essential for comparing means across multiple groups while controlling for blocking variables. The host, Brandon, begins by encouraging viewers to stay positive and provides social media links for updates. He then walks through the process of calculating ANOVA by hand using Microsoft Excel, comparing results with SPSS output for validation. The tutorial covers key concepts, formulas, and the rationale behind each step, ensuring viewers understand not just the 'how' but the 'why' of ANOVA calculations.
Takeaways
- 📚 The video is part of a series on basic statistics, focusing on the two-way block ANOVA, also known as two-way ANOVA without replication.
- 🤗 The presenter encourages viewers to stay positive and keep working hard, especially if they are struggling with the material, emphasizing that they have already accomplished a lot.
- 🔗 The video invites viewers to follow the presenter on various social media platforms to stay updated with new content and to connect with the community.
- 👍 Viewers are encouraged to like, share, and comment on the video to provide feedback and support the creation of more content.
- 📈 The video explains the concept of two-way block ANOVA in a slow and deliberate manner, ensuring viewers understand not just the 'what' but also the 'why' and 'how'.
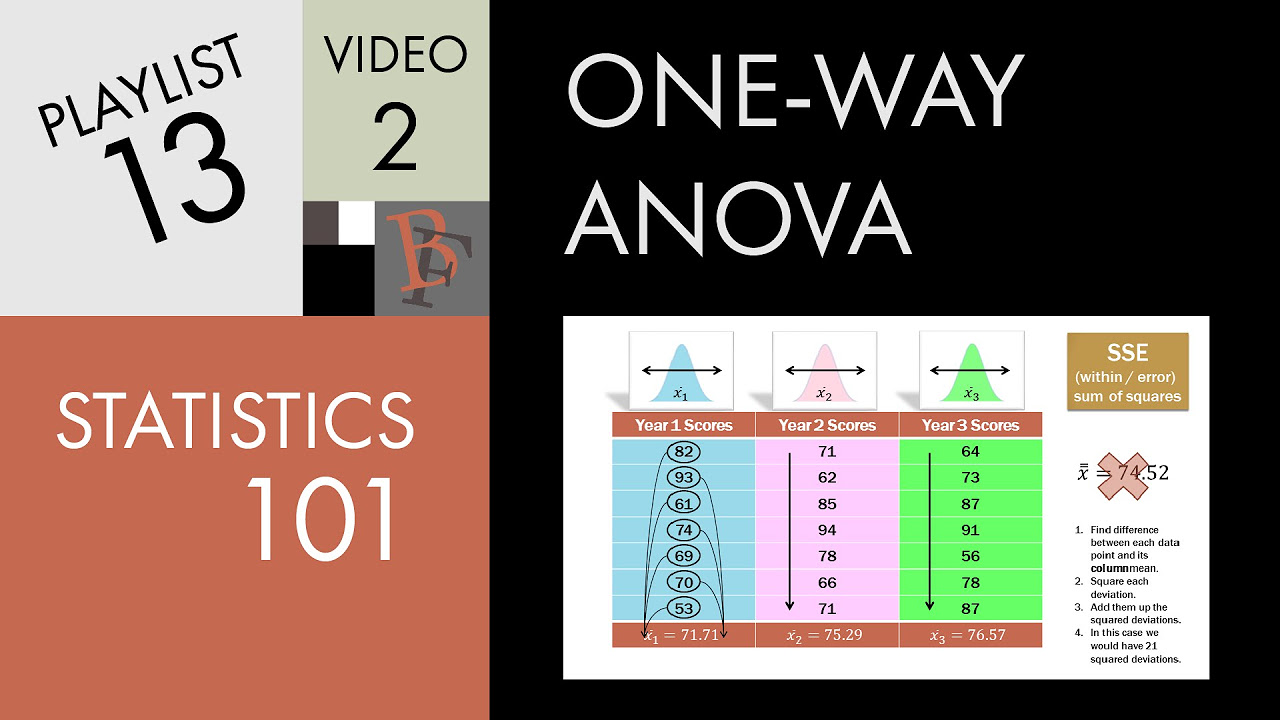
- 📊 The presenter outlines the importance of calculating sum of squares (SS) for columns, blocks, and error, and how these relate to degrees of freedom and mean squares in the context of ANOVA.
- 🧐 The video discusses the process of partitioning the total sum of squares into components that represent the variance due to columns, blocks, and error, aiming to minimize the error term.
- 📝 The script includes a step-by-step guide on how to perform a two-way ANOVA calculation manually using Microsoft Excel, comparing results with built-in formulas and SPSS output.
- 📉 The video emphasizes the significance of F-ratios in determining whether differences exist between groups (cities and shoppers) and how these ratios are used in hypothesis testing.
- 🏢 The example used in the video involves analyzing customer service scores for different cities, using shopper scores as a blocking variable to account for variance between individuals.
- 📈 The presenter uses a visual chart from SPSS to illustrate the differences in estimated marginal means across cities and shoppers, highlighting the utility of graphical representation in statistical analysis.
Q & A
What is the main topic of the video series?
-The main topic of the video series is basic statistics, with a focus on two-way block ANOVA, also known as two-way ANOVA without replication or two-factor ANOVA without replication.
Why does the instructor encourage viewers to stay positive when struggling with statistics?
-The instructor encourages viewers to stay positive because struggling with statistics is common, and maintaining a positive attitude can help them overcome temporary difficulties with hard work, practice, and patience.
What are the different ways the instructor suggests to follow their content?
-The instructor suggests following them on YouTube, Twitter, Google Plus, or LinkedIn to stay updated with new video uploads and to connect with the instructor and other viewers.
How does the instructor motivate viewers to engage with the video content?
-The instructor motivates viewers by asking them to give the video a thumbs up, share it with classmates or colleagues, or add it to a playlist, which encourages the instructor to continue making videos.
What is the purpose of the two-way block ANOVA discussed in the video?
-The purpose of the two-way block ANOVA is to determine if there are significant differences between two factors (e.g., cities and shoppers) while accounting for the variation within those factors to get a clearer picture of the effects.
How does the video guide viewers through the process of understanding two-way block ANOVA?
-The video guides viewers by first providing a conceptual background in part one, then moving on to part two where calculations are demonstrated using PowerPoint slides and Microsoft Excel, comparing results with built-in formulas and outputs from SPSS.
What is the significance of the sum of squares (SS) in the context of ANOVA?
-The sum of squares represents the total variability in the data that is partitioned into different components, such as columns (treatments), blocks, and error, to determine the sources of variance in the dataset.
How does the instructor demonstrate the calculation of degrees of freedom in ANOVA?
-The instructor demonstrates the calculation of degrees of freedom by subtracting one from the number of columns (C-1) for columns, subtracting one from the number of blocks (B-1) for blocks, and multiplying these by the number of blocks and columns respectively for error.
What is the role of the mean square (MS) in ANOVA calculations?
-The mean square is the sum of squares divided by its corresponding degrees of freedom. It is used to estimate the variance within each source of variability (columns, blocks, error) and is crucial for calculating the F-ratio.
How does the video help viewers understand the relationship between the F-ratio and the significance of results in ANOVA?
-The video explains that the F-ratio is a comparison between the mean square of the columns (or groups) and the mean square error. A significant F-ratio (larger than the critical value from the F-distribution) indicates that there are significant differences between the groups.
What is the purpose of using Excel in the video to perform ANOVA calculations?
-Using Excel allows viewers to see the step-by-step process of performing ANOVA calculations manually, which helps in understanding where the numbers come from and how the calculations are done outside of statistical software.
How does the video script address the concept of blocking in two-way ANOVA?
-The script addresses the concept of blocking by explaining that it allows for the partitioning of total variance into different sources, including the blocks, which helps in reducing the error term and making it easier to detect differences in the columns.
Outlines
📚 Introduction to Basic Statistics Video Series
In the introductory segment, Brandon greets viewers and encourages those struggling with statistics to stay positive, highlighting their achievements and potential. He invites viewers to follow him on various social media platforms for updates on new content and emphasizes the importance of connecting despite life's brevity and the world's vastness. Brandon also asks viewers to engage with the content by liking, sharing, or providing constructive feedback to improve future videos. The video is aimed at beginners in statistics, and Brandon promises to explain basic concepts thoroughly, including the application of two-way block ANOVA without replication.
🔍 Setting Up for Two-Way ANOVA Without Replication
The script transitions into discussing the setup for a two-way ANOVA without replication, explaining the importance of the problem's context and the potential to examine either city or shopper differences while controlling for the other variable. It outlines the basic formulas for two-way ANOVA, including total observations (N), number of columns or groups (C), and the sum of squares for columns (SSC), blocks or rows (SSB), and error (SSE). The paragraph also details the degrees of freedom and mean square calculations for each component, setting the stage for the hands-on Excel demonstration to follow.
📋 Excel Setup for Two-Way ANOVA Calculation
This paragraph describes the initial setup in Excel for manually calculating two-way ANOVA. It mentions the workbook's structure, including different tabs for SST, SSC, SSB, and a tab for Excel's own ANOVA output. The data tab contains the original data set with cities, shoppers, and ratings, alongside basic information about the data set's composition. The paragraph also includes a brief overview of the SPSS output and the importance of核对ing the hand calculations with it. The Excel process begins with calculating row and column means and the overall mean, setting the stage for further calculations.
🧮 Calculating Sum of Squares Total (SST)
The script explains the process of calculating the sum of squares total (SST) in Excel by demonstrating how to find the difference between each individual data point and the overall mean, square these differences, and sum them up. It provides step-by-step instructions on using Excel functions to automate parts of this calculation, resulting in an SST value of 1750, which is then used in subsequent calculations.
📘 Detailed Calculation of SSC and SSB in Excel
This paragraph delves into the detailed process of calculating the sum of squares for columns (SSC) and blocks (SSB) using Excel. It explains how to find the difference between the column or row mean and the overall mean, square these differences, sum them up, and then multiply by the appropriate number of blocks or columns to get the correct sum of squares. The paragraph ensures that viewers understand the rationale behind each step and how these calculations contribute to the overall ANOVA analysis.
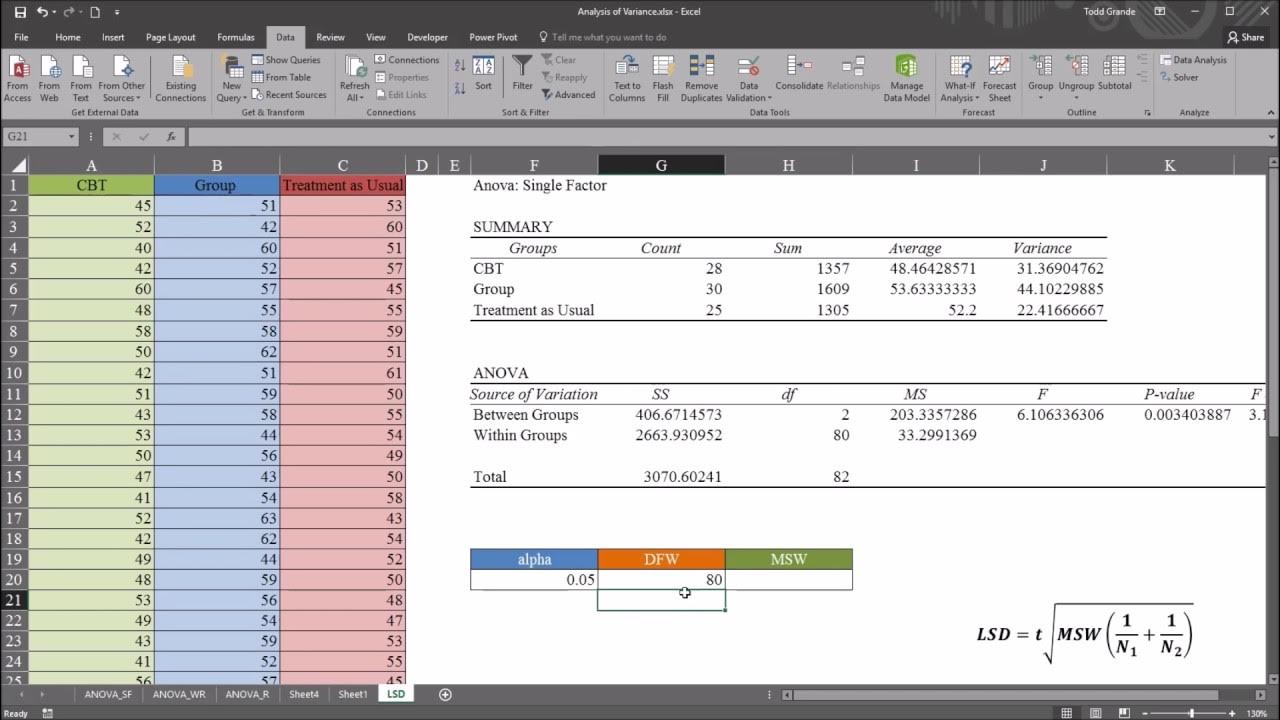
📊 Finding the Sum of Squares Error (SSE) and Mean Squares
The script outlines how to determine the sum of squares error (SSE) by subtracting the SSC and SSB from the SST, resulting in an SSE of 475. It then explains the calculation of mean squares for total (MST), columns (MSC), blocks (MSB), and error (MSE) by dividing the respective sum of squares by their degrees of freedom. The paragraph also compares these calculated values with the SPSS output to ensure accuracy.
📈 Defining and Calculating F Ratios in ANOVA
This paragraph focuses on defining F ratios in the context of ANOVA and calculating them for both columns and blocks. It describes the significance of F ratios in determining the presence of variance between groups and how they are used to compare the mean squares of columns and blocks with the mean square error. The script provides the calculated F ratios and shows how they match the SPSS output, validating the manual calculations performed in Excel.
🛠️ Using Excel's Built-In Two-Way ANOVA Tool
The script demonstrates how to use Excel's built-in two-way ANOVA tool to analyze the data, providing an alternative method to the manual calculations. It guides viewers through the process of accessing the tool via the Data Analysis feature, inputting the correct range and settings, and interpreting the output. The paragraph emphasizes the importance of data formatting and compares the results obtained from Excel's tool with those from the manual calculations and SPSS output.
📉 Interpreting the Results of Two-Way ANOVA
This paragraph interprets the results of the two-way ANOVA, highlighting the significance of the city scores even after accounting for shopper variations. It discusses the P-values and the decision to reject or fail to reject the null hypothesis based on these values. The script also mentions the importance of understanding where the differences lie, suggesting that visual tools like charts can help illustrate these differences.
📈 Conclusion and Summary of Two-Way ANOVA
In the concluding paragraph, the script summarizes the findings of the two-way ANOVA, emphasizing the significant differences in mean quality scores by city. It explains the use of the F ratio and how it compares to the critical value from the F table to make statistical conclusions. The paragraph also touches on the concept of blocking variables in ANOVA and their role in partitioning variance, leading to more powerful hypothesis tests.
🔬 Purpose of Blocking Variables in ANOVA
The final paragraph delves into the purpose of blocking variables in ANOVA, explaining how they help refine the assignment of overall variance and increase the power of hypothesis tests. It discusses the goal of reducing the error term by assigning it to columns or blocks and the importance of this approach in detecting column differences more easily.
Mindmap
Keywords
💡Basic Statistics
💡Two-Way ANOVA
💡Replication
💡Sum of Squares (SS)
💡Degrees of Freedom (df)
💡Mean Square (MS)
💡F-Ratio
💡Significance
💡Excel
💡Blocking Variable
Highlights
Introduction to the two-way block ANOVA (without replication), emphasizing its importance for analyzing data with two factors.
Encouragement for students struggling with statistics, highlighting the importance of positivity and perseverance.
Advice on following the instructor on various social media platforms for updates and community engagement.
Invitation for viewers to provide feedback and suggestions for video improvement through constructive comments.
Explanation of the two-way ANOVA setup, including the significance of cities and shoppers in the study.
Clarification on the focus of the analysis, which is to determine differences between cities while controlling for shopper variance.
Introduction of the concept of partitioning the total sum of squares into components attributed to columns, blocks, and error.
Description of the process to calculate the sum of squares for columns (SSC) and its role in understanding city differences.
Detailed walkthrough of calculating the sum of squares for blocks (SSB) and its importance in reducing error variance.
Methodology for finding the sum of squares error (SSE) through subtraction of SSC and SSB from the total sum of squares (SST).
Calculation of mean squares for columns (MSC), blocks (MSB), and error (MSE), emphasizing their role in determining variance sources.
Discussion on the F-ratio and its significance in comparing variances between columns (or blocks) and error.
Demonstration of how to use Excel for two-way ANOVA calculations, comparing manual calculations with built-in functions.
Analysis of the results from Excel's ANOVA tool, comparing them with manual calculations and SPSS output for validation.
Interpretation of the F-ratios and their corresponding P-values to determine significance of differences between cities and shoppers.
Visual representation of the data using SPSS-generated charts to illustrate differences in estimated marginal means by city and shopper.
Summary of the importance of ANOVA in analyzing complex datasets with multiple populations and factors.
Final thoughts on the role of blocking variables in refining variance partitioning and enhancing hypothesis testing power.
Transcripts
Browse More Related Video
Statistics 101: One-way ANOVA, A Visual Tutorial
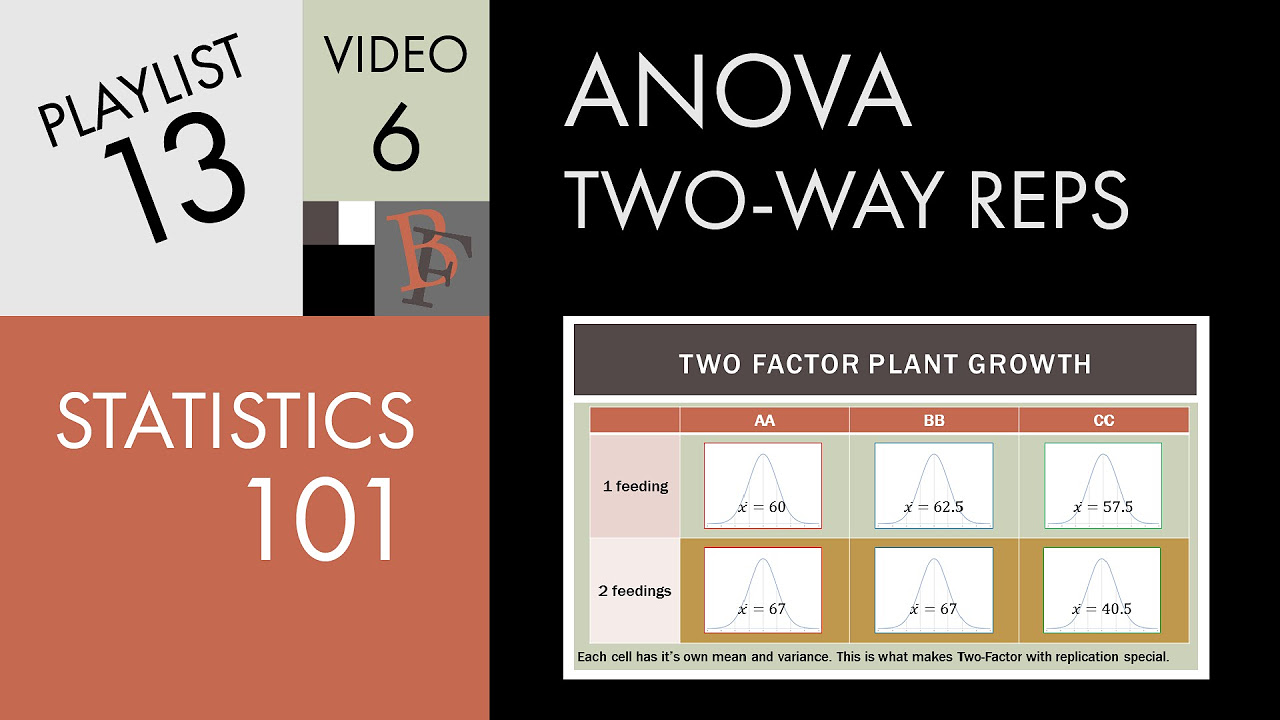
Statistics 101: Two-way ANOVA with Replication, An Introduction
One-Way ANOVA with LSD (Least Significant Difference) Post Hoc Test in Excel

SPSS (9): Mean Comparison Tests | T-tests, ANOVA & Post-Hoc tests

How to Calculate ANOVA with Excel (Analysis of Variance)

Statistics 101: Two-way ANOVA w/o Replication, A Visual Guide
5.0 / 5 (0 votes)
Thanks for rating: