Motion Graphs - AP Physics 1: Kinematics Review Supplement
TLDRIn this educational video, the host guides viewers through solving motion graph problems in preparation for the AP Physics 1 exam. The discussion revolves around interpreting velocity versus time and acceleration versus time graphs. Key concepts include understanding that the slope of a position-time graph represents velocity, and the slope of a velocity-time graph represents acceleration. The area under the velocity-time graph equates to the change in position, while the 'signed area' under the acceleration-time graph represents the change in velocity. The video also highlights common mistakes made by students, such as forgetting to account for negative areas under the curve, and emphasizes the importance of these concepts for the AP exam.
Takeaways
- 📚 The video is part of an AP Physics 1 review session focusing on motion graph problems.
- 🚗 The first problem involves a car accelerating and then decelerating, with the corresponding velocity-time graph provided.
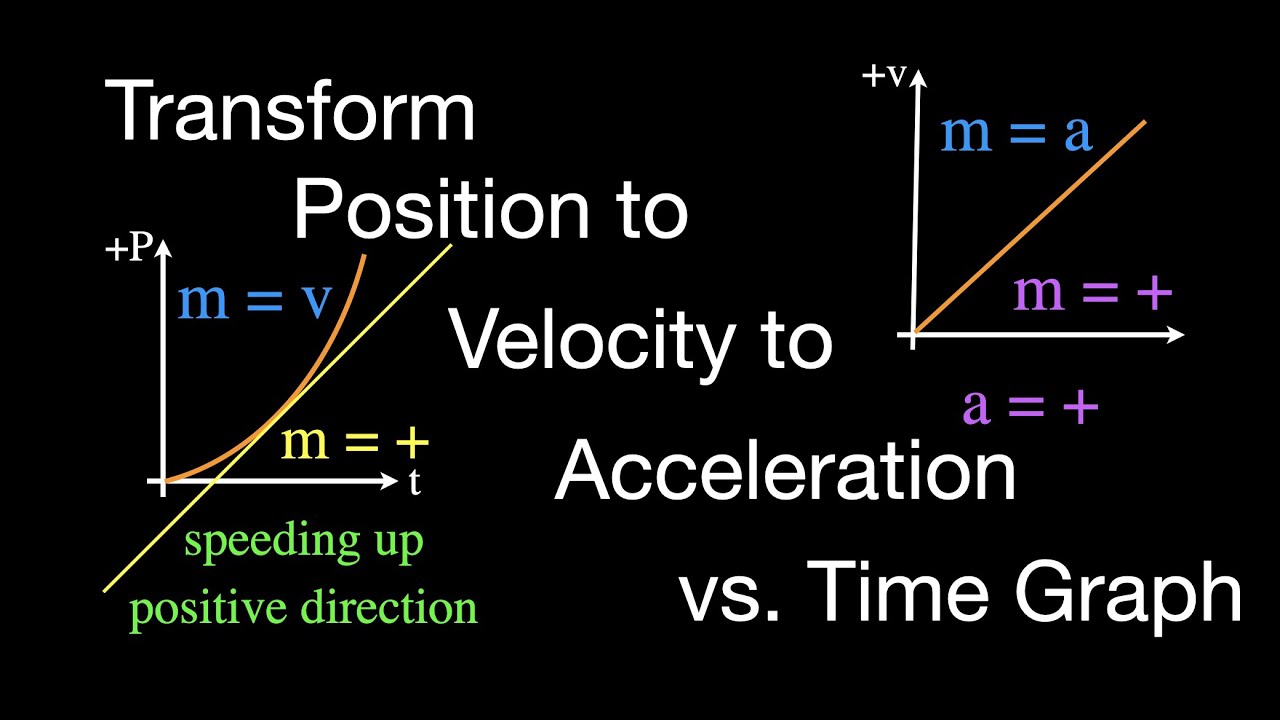
- 📈 The slope of a position-time graph represents velocity, and the initial slope should match the initial velocity from the velocity-time graph.
- 🔍 Choice A is identified as the correct position-time graph because it starts with zero slope, aligning with the initial velocity of zero.
- 🛑 The acceleration phase of the car's motion is represented by a positive slope in the velocity-time graph, indicating uniform acceleration.
- 🔽 The deceleration phase is shown by a negative slope in the velocity-time graph, representing uniform deceleration.
- 📊 The second problem involves calculating the velocity of a particle at a specific time given its acceleration-time graph and initial velocity.
- ⏱ The area under the acceleration-time graph represents the change in velocity, with consideration for the 'signed area' to account for direction.
- 🔢 The correct calculation of the 'signed area' leads to the correct final velocity of the particle, which is negative 2 m/s for the given scenario.
- 🚫 The video script highlights the importance of not making common mistakes, such as forgetting to include the negative sign in calculations.
- 💡 The concepts discussed are likely to appear on the AP Physics 1 exam and are often combined with other topics in the curriculum.
Q & A
What is the purpose of the video script?
-The purpose of the video script is to review motion graph problems for the AP Physics 1 exam as part of the Ultimate Review Packet.
What is the significance of the slope in a velocity versus time graph?
-The slope of a velocity versus time graph represents acceleration. A constant positive slope indicates uniform acceleration in a positive direction, while a constant negative slope indicates uniform acceleration in a negative direction.
How does the initial slope of the position versus time graph relate to the initial velocity?
-The initial slope of the position versus time graph is equal to the initial velocity. If the initial velocity is zero, the initial slope of the position graph must also be zero.
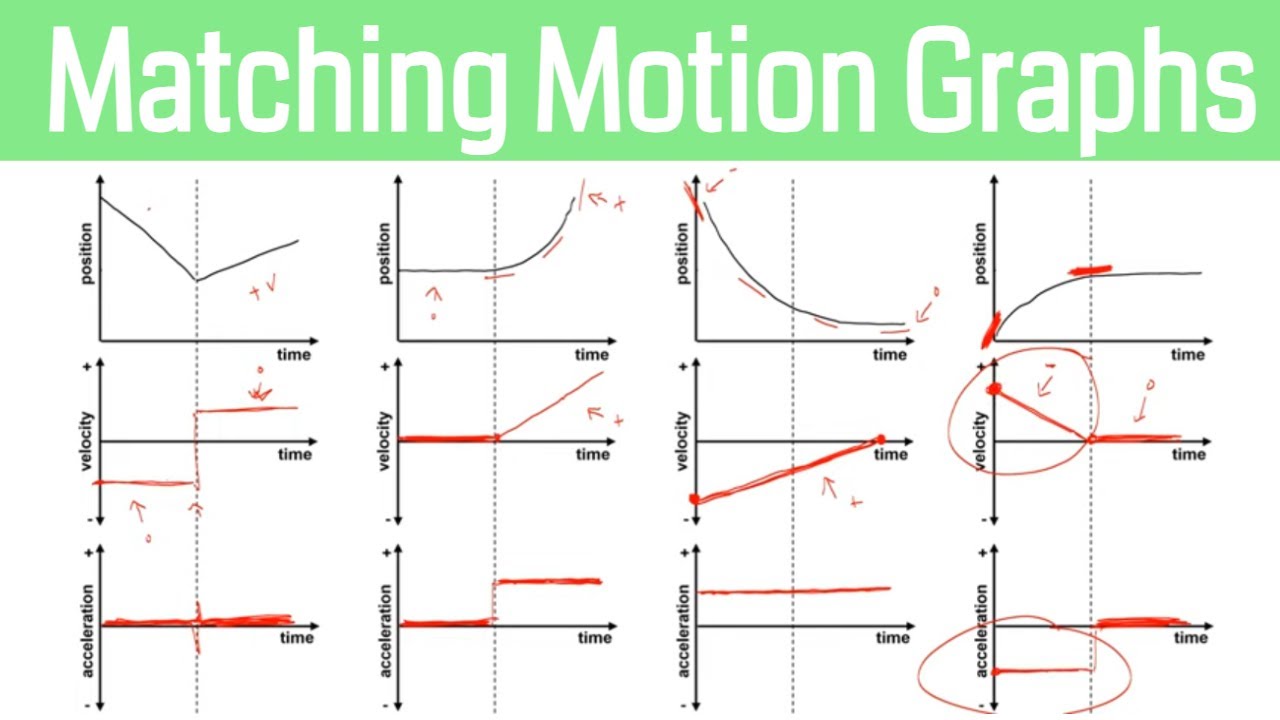
Which position versus time graph matches the given velocity versus time graph in the script?
-Choice A is the position versus time graph that matches the given velocity versus time graph because it has an initial slope of zero and its slope changes align with the acceleration depicted in the velocity graph.
What is the relationship between the area under an acceleration versus time graph and velocity?
-The area under an acceleration versus time graph, also known as the 'signed area', represents the change in velocity. The total area above the horizontal axis minus the total area below it gives the net change in velocity.
What mistake did Bo make in calculating the 'signed area' under the acceleration versus time graph?
-Bo's mistake was not accounting for the fact that the area below the horizontal axis is negative. He did not consider the 'signed area', which led to an incorrect calculation of the final velocity.
What is the correct final velocity of the particle at t equals 8 seconds, given the initial velocity was negative 10 m/s?
-The correct final velocity of the particle at t equals 8 seconds is negative 2 meters per second (choice A), after properly accounting for the 'signed area' under the acceleration versus time graph.
Why does the AP exam include multiple-choice answers that result from common mistakes?
-The AP exam includes such answers to predict and test for common mistakes students might make, ensuring a thorough understanding of the concepts.
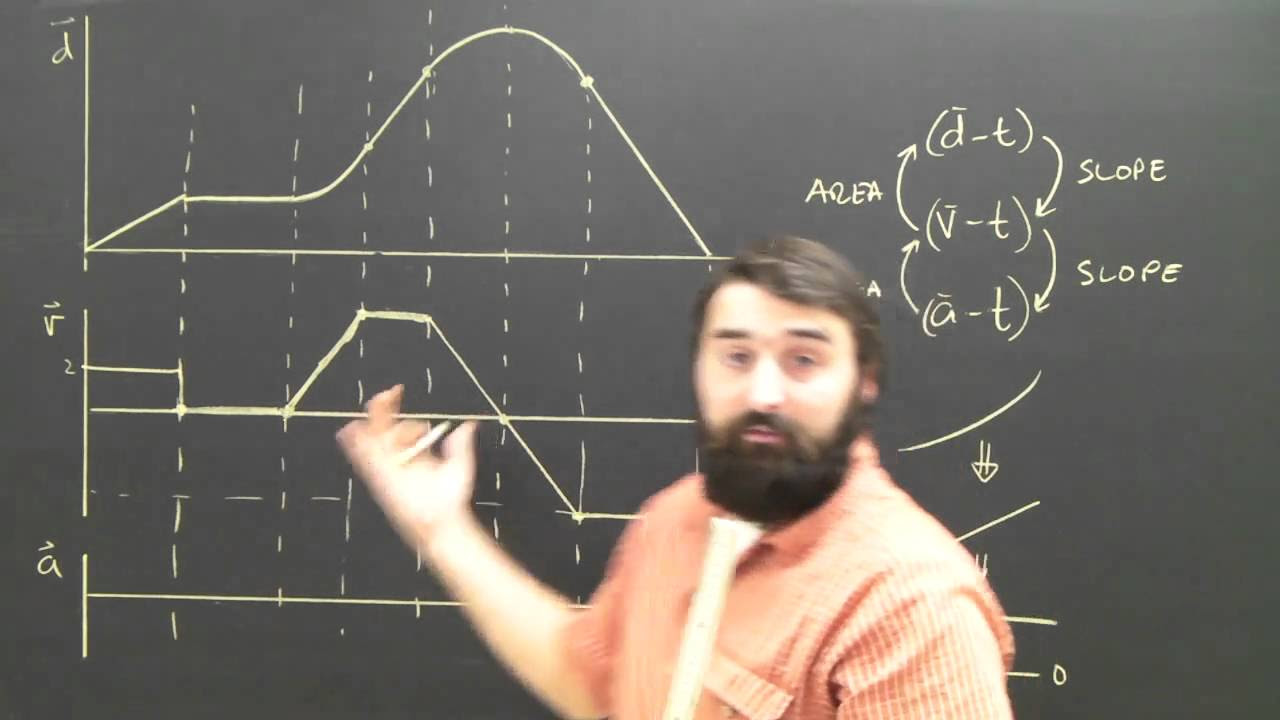
What is the relationship between the slope of a position versus time graph and velocity?
-The slope of a position versus time graph is equal to velocity. As time progresses, the change in position divided by the change in time gives the velocity at that instant.
What is the relationship between the slope of a velocity versus time graph and acceleration?
-The slope of a velocity versus time graph is equal to acceleration. It shows how the velocity of an object is changing over time.
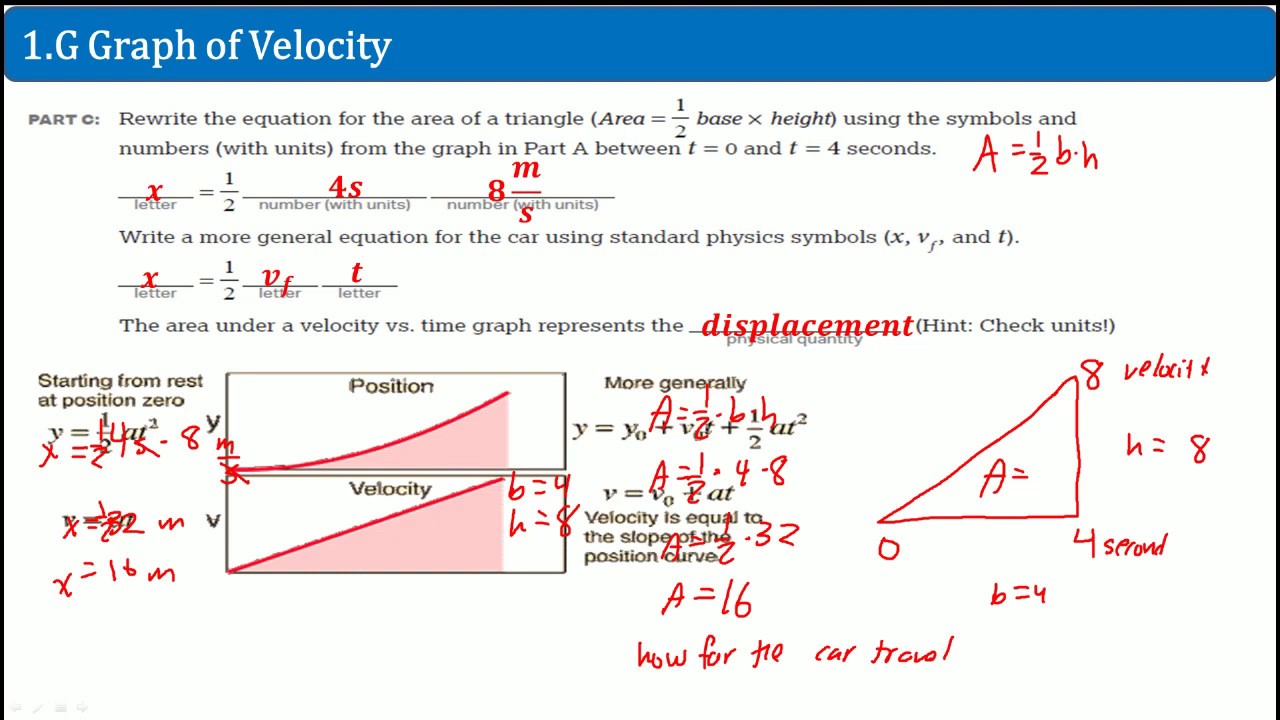
What does the area under a velocity versus time graph represent?
-The area under a velocity versus time graph represents the change in position, also known as displacement.
What is the significance of the 'signed area' under an acceleration versus time graph?
-The 'signed area' under an acceleration versus time graph represents the change in velocity. It takes into account both the magnitude and direction of the acceleration over time.
Outlines
📈 Motion Graphs and AP Physics 1 Review
This paragraph introduces a segment of an AP Physics 1 review session focused on motion graphs. The instructor discusses the importance of understanding how to interpret velocity versus time and position versus time graphs, particularly in the context of uniform acceleration and deceleration. A problem is presented where a car accelerates and then decelerates, and the students are tasked with identifying the correct position versus time graph that corresponds to the given velocity graph. The correct answer is determined by analyzing the slopes and initial conditions of the graphs. The instructor emphasizes the need for a thorough understanding of these concepts for the AP exam.
📚 Signed Area and Common Mistakes in Motion Analysis
In this paragraph, the discussion continues with a problem involving the acceleration of a particle over time and the calculation of its velocity at a specific time. The concept of 'signed area' under the acceleration versus time graph is introduced, which accounts for the direction of the velocity change. The students initially make a mistake by not considering the negative signed area, leading to an incorrect answer. The instructor corrects this by emphasizing the importance of including the sign of the area in calculations. The paragraph also touches on the common pitfalls that students might encounter on the AP exam, such as forgetting to include negative signs, and how these mistakes are often reflected in the multiple-choice answers provided on the exam. The summary concludes with a reminder of the key concepts related to motion graphs and their significance in the AP Physics 1 curriculum.
Mindmap
Keywords
💡Uniform Acceleration
💡Velocity vs. Time Graph
💡Position vs. Time Graph
💡Acceleration
💡Signed Area
💡Change in Velocity
💡AP Physics 1 Exam
💡Initial Velocity
💡Final Velocity
💡Multiple Choice Answers
💡Common Mistakes
Highlights
Introduction to motion graph problems for AP Physics 1 exam review.
The importance of the slope in a position versus time graph representing velocity.
Initial slope of the position versus time graph must be zero if initial velocity is zero.
Choice A is the correct position versus time graph based on the given velocity graph.
Explanation of uniformly accelerated motion with positive and negative acceleration.
The relationship between the slope of the position graph and the velocity graph.
The area under an acceleration versus time graph equals the change in velocity.
Calculation of the 'signed area' for determining the change in velocity.
Mistake made in calculating the 'signed area' and its correction.
The significance of including negative values in the calculation of final velocity.
Common mistakes made by students and how they are reflected in exam choices.
Discussion on the ethics of exam question construction and predicting student mistakes.
Review of key concepts: slope of position-time graph is velocity, slope of velocity-time graph is acceleration.
Explanation of the area under a velocity-time graph representing change in position.
Clarification on the 'signed area' under an acceleration-time graph representing change in velocity.
Conclusion emphasizing the importance of motion graphs in AP Physics 1 exam.
Transcripts
Browse More Related Video

Velocity Time Graphs, Acceleration & Position Time Graphs - Physics

High School Physics: Graphing Motion
AP Physics Workbook 1.G Graphs of Velocity
Distance (position) to Velocity Time Graph Physics Help
Motion Graphs: Transforming Position to Velocity to Acceleration vs Time
How to Match Motion Graphs in Physics
5.0 / 5 (0 votes)
Thanks for rating: