AP Physics Workbook 1.G Graphs of Velocity
TLDRThe video script discusses the analysis of a car's motion using a velocity-time graph from an AP Physics 1 workbook. It explains how to plot the graph, calculate the slope (which represents acceleration), and determine the area under the curve (representing displacement). The script emphasizes understanding the relationship between position, velocity, and acceleration, and how calculus concepts such as derivatives and integrals apply to these physical quantities.
Takeaways
- 🚗 The scenario involves a car traveling in a straight line to the right, with its velocity graph and specific time points given.
- 📈 The velocity-time graph is plotted based on the provided data points, showing the car's speed in meters per second over a 4-second interval.
- 🎯 The slope of the velocity-time graph is calculated using two points, resulting in a value of 2 meters per second squared, representing the acceleration.
- 📌 The units for acceleration are meters per second squared, derived from the change in velocity over time.
- 🔺 The area under the velocity-time graph represents the displacement of the car, calculated as 1/2 base times height of the triangle formed.
- 🤔 The area calculation demonstrates the concept that displacement equals the average velocity multiplied by time, with units of meters.
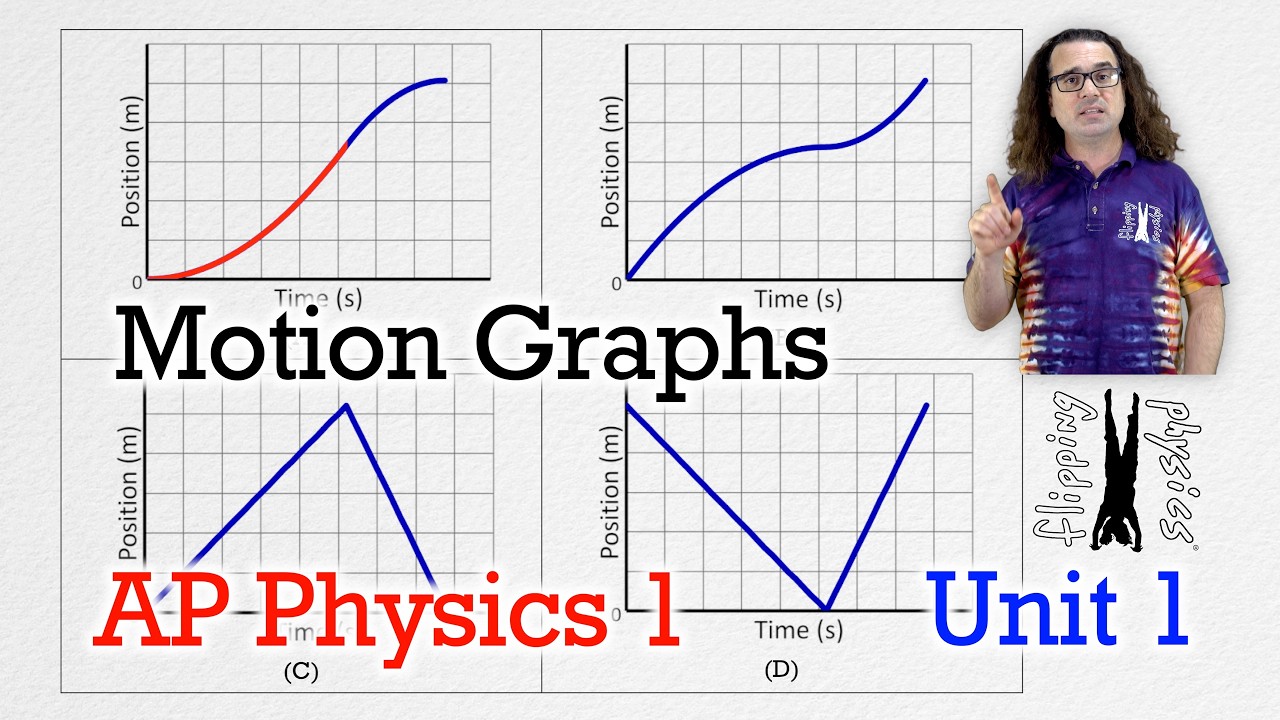
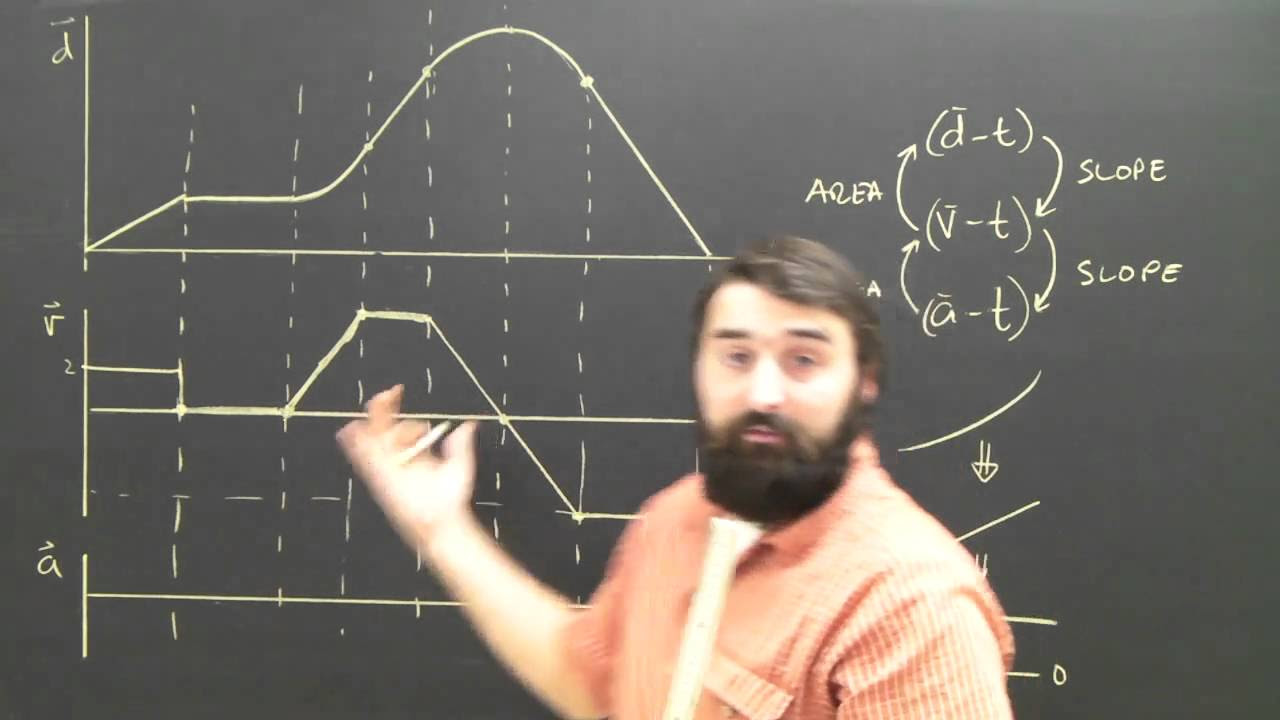
- 📚 The script connects the idea that the slope of a position-time graph gives velocity, and the area under the curve represents displacement.
- 🌟 The explanation emphasizes the relationship between calculus operations and physical concepts, such as derivatives for velocity and integrals for position.
- 🎓 The video script serves as a solution for a problem in an AP Physics 1 workbook, providing a practical application of physics concepts.
- 👍 The use of data points for calculations is highlighted as a practical approach despite the challenge of avoiding fractions.
- 📊 The visual representation of the velocity graph and the triangle formed helps in understanding the concepts of slope and area in relation to motion.
Q & A
What is the initial velocity of the car at T=0 according to the scenario described?
-The initial velocity of the car at T=0 is 0 meters per second.
How does the car's velocity change over the first 4 seconds?
-The car's velocity increases linearly over the first 4 seconds, with velocities of 4 meters per second at T=2 and 8 meters per second at T=4.
What does the slope of the velocity vs. time graph represent?
-The slope of the velocity vs. time graph represents the acceleration of the car, which is calculated to be 2 meters per second squared.
Why does the person presenting the solution decide to use data points for calculating the slope, despite initially suggesting not to?
-The presenter decides to use data points for calculating the slope because they provide perfect values, making the calculation straightforward and avoiding the complication of using fractions or non-data points.
How is the area under the velocity vs. time graph related to the car's motion?
-The area under the velocity vs. time graph represents the displacement of the car, which in this case is calculated to be 16 meters. This area tells us how far the car has traveled.
What formula is used to calculate the area of the triangle representing the car's motion on the graph, and what does it signify?
-The formula used is 1/2 base times height, where the base is the time interval (4 seconds) and the height is the final velocity (8 meters per second). This formula calculates the displacement of the car, signifying how far the car travels.
What are the units of the slope of the velocity vs. time graph, and what physical quantity do they represent?
-The units of the slope are meters per second squared, representing the acceleration of the car.
How does understanding the slope and area under the curve enhance one's comprehension of motion graphs?
-Understanding the slope and area under the curve helps to connect the concepts of velocity, acceleration, and displacement, illustrating how changes in motion are graphically represented and calculated.
Why is the area calculation important in the context of the car's motion, and what does it ultimately determine?
-The area calculation is important because it determines the car's displacement, indicating the total distance traveled by the car over the specified time interval.
How does the presenter link the concepts of calculus to the analysis of the car's motion graph?
-The presenter links calculus concepts by explaining how the derivative (slope) relates to velocity and how integration (area under the curve) relates to displacement, emphasizing the mathematical relationship between position, velocity, and acceleration.
Outlines
📊 Velocity Graph Analysis and Slope Calculation
This paragraph introduces the concept of a velocity graph for a car traveling in a straight line to the right. The car's velocity increases from 4 meters per second at T=0 to 8 meters per second at T=2 seconds. The task is to plot the velocity versus time graph for the first 4 seconds of travel. The graph is then used to calculate the slope, which represents the acceleration. Despite the suggestion not to use data points, the instructor opts for simplicity and uses them anyway, resulting in a slope of 2 meters per second squared. This slope value is then used to make claims about the motion of the car, highlighting the units and their significance in the context of velocity and acceleration.
📐 Deriving Displacement from the Area Under the Velocity Curve
In this paragraph, the focus shifts to understanding the relationship between the area under the velocity curve and the car's displacement. The area of a triangle is used as an analogy, with the base representing time and the height representing velocity. The area calculation (1/2 base times height) is applied to the triangle formed by the velocity graph, resulting in a displacement value. The paragraph emphasizes the connection between calculus concepts and the practical application of calculating displacement, and it encourages viewers to explore further related topics in other videos.
Mindmap
Keywords
💡Velocity
💡Graph
💡Acceleration
💡Slope
💡Data Points
💡Area of Triangle
💡Displacement
💡Calculus
💡Derivative
💡Integral
💡Motion Graph
Highlights
The transcript discusses a physics problem related to a car's motion, specifically its velocity and displacement.
The car's velocity is given at two different time intervals, 4 m/s at T=2 and 8 m/s at T=3.
A velocity-time graph is plotted for the first 4 seconds of the car's travel.
The graph's scale and labeling are described, with specific points mentioned: (0,0), (1,2), (2,4), (3,6), and (4,8).
The slope of the velocity-time graph is calculated to be 2 m/s^2 using two points on the line, (1,2) and (3,6).
The units for the slope (acceleration) are meters per second squared, indicating the car's acceleration.
The area under the velocity-time graph represents the car's displacement.
The area of a triangle formed on the graph is calculated as 1/2 * base * height, resulting in an area of 16 square units.
The displacement of the car is derived from the area under the curve, with units of meters, confirming the car's movement.
The concept of converting position to velocity through calculus is briefly introduced, mentioning derivatives.
The idea of transitioning from area (velocity) to position through integration is also touched upon.
The transcript serves as a lesson on the relationship between velocity, acceleration, and displacement in physics.
The problem-solving approach demonstrates the practical application of mathematical concepts in physics.
The explanation is tailored to help students understand the fundamentals of kinematics and the power of visual representations like graphs.
The transcript is a part of an AP Physics 1 workbook, indicating its target audience and educational purpose.
The use of data points and graphing techniques provides a hands-on learning experience for students.
Transcripts
Browse More Related Video

Velocity Time Graphs, Acceleration & Position Time Graphs - Physics
Motion Graphs - AP Physics 1: Kinematics Review Supplement
Distance (position) to Velocity Time Graph Physics Help

AP Physics Workbook 1.H Relationship between Position,Velocity and Acceleration

High School Physics: Graphing Motion
Visualizing Motion Using Tape Charts and Motion Graphs | SCIENCE 7 QUARTER 3 MODULE 2 WEEK 3
5.0 / 5 (0 votes)
Thanks for rating: