P Value and Hypothesis Testing Simplified|P-value and Hypothesis testing concepts in Statistics
TLDRIn this video, data scientist Aman unravels the complexities surrounding p-values and hypothesis testing in the realm of data science. He begins by defining the p-value as the probability of the null hypothesis being true and explains the concept of the null hypothesis as an assumption that treats all situations as equal. Using the example of global GDP before and after a pandemic, Aman illustrates how data can be used to either accept or reject the null hypothesis in favor of an alternate hypothesis. He outlines the process of hypothesis testing, which includes collecting data, defining a significance level, and conducting statistical tests such as t-tests, chi-squared tests, ANOVA, and z-tests to obtain a p-value. Aman emphasizes the importance of interpreting the p-value in relation to the significance level, explaining that a p-value less than 0.01 indicates very strong evidence against the null hypothesis, while a value between 0.01 and 0.05 suggests strong evidence, and a value above 0.1 implies no evidence against it. He promises to delve deeper into these tests and their applications in future videos, inviting viewers to engage with any questions or comments.
Takeaways
- 📊 **P-value Definition**: The p-value is defined as the probability of the null hypothesis being true.
- 🧐 **Understanding Null Hypothesis**: The null hypothesis is an assumption that everything is equal and similar, serving as a default starting point for statistical tests.
- 🌐 **Example of Null Hypothesis**: An example given is that the global GDP before and after a pandemic is the same, which is a statement that treats both situations as identical.
- 📉 **Use of P-value**: The p-value is used with data to prove or disprove the null hypothesis, leading to the acceptance of the alternate hypothesis if the null is rejected.
- 🔍 **Hypothesis Testing Process**: Hypothesis testing involves collecting data, defining a significance level, and then either accepting or rejecting the null hypothesis based on the p-value.
- 📋 **Significance Level**: The significance level (commonly set at 0.05) represents the probability of the null hypothesis holding true in a random sample of data.
- 📈 **Data Collection**: The first step in hypothesis testing is to collect relevant data, such as GDP data from different countries pre and post-pandemic.
- 🧐 **Interpreting P-value**: The p-value, in conjunction with the significance level, helps determine whether there is enough evidence to reject the null hypothesis.
- 🔢 **Statistical Tests**: Various statistical tests like t-test, chi-squared test, ANOVA, and z-test are used to calculate the p-value from collected data.
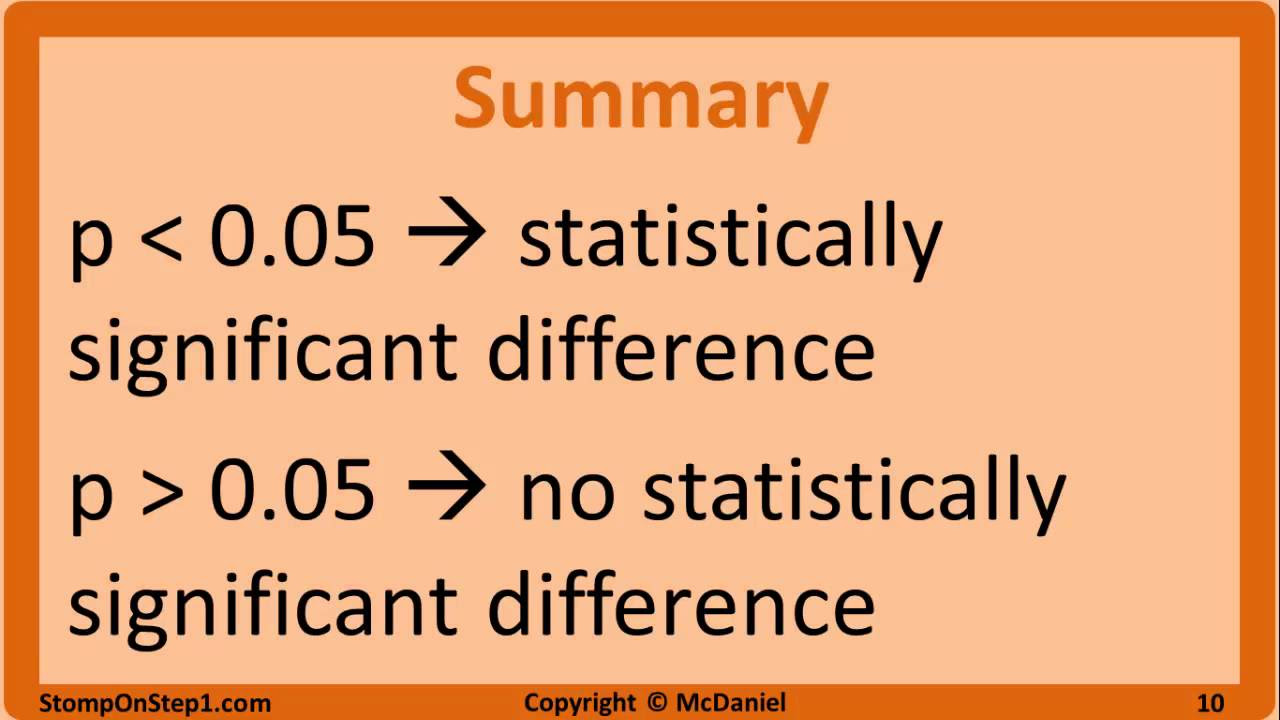
- 📉 **Strength of Evidence**: A p-value less than 0.01 indicates very strong evidence against the null hypothesis, while a p-value between 0.01 and 0.05 suggests strong evidence, and a p-value above 0.1 indicates no significant evidence against the null hypothesis.
- ➡️ **Upcoming Content**: The speaker plans to explain different statistical tests and how to interpret p-values in future videos.
Q & A
What is the definition of a p-value in the context of data science?
-A p-value is the probability of the null hypothesis being true. It is used to evaluate the strength of evidence against the null hypothesis in statistical testing.
What is a null hypothesis?
-A null hypothesis is an assumption that treats all conditions as equal and similar. It is a default position that is used as a basis for statistical testing.
How does the concept of a null hypothesis apply to the example of global GDP before and after a pandemic?
-In the example, the null hypothesis assumes that the global GDP before the pandemic is the same as after the pandemic, suggesting no significant change due to the pandemic.
What is the significance level in hypothesis testing?
-The significance level is a threshold used to decide whether to reject the null hypothesis. A common significance level is 0.05, meaning that there is a 5% chance that the null hypothesis is true.
How do you interpret a p-value of less than 0.01 in the context of hypothesis testing?
-A p-value of less than 0.01 indicates very strong evidence against the null hypothesis, suggesting that the null hypothesis is true in only 1% of the cases.
What are some common statistical tests used to obtain a p-value?
-Common statistical tests include the t-test, chi-squared test, ANOVA (analysis of variance), and z-test. These tests are used on data to produce a p-value.
What is the role of data in hypothesis testing?
-Data is crucial in hypothesis testing as it is used to prove or disprove the null hypothesis. By analyzing the data, researchers can determine whether to accept or reject the null hypothesis based on the p-value and significance level.
What is an alternate hypothesis?
-An alternate hypothesis is a statement that contradicts the null hypothesis. It is what researchers accept if the null hypothesis is rejected based on statistical evidence.
How does the strength of evidence against the null hypothesis change if the p-value is between 0.01 and 0.05?
-If the p-value is between 0.01 and 0.05, it is considered strong evidence against the null hypothesis, indicating a higher likelihood that the null hypothesis is false.
What does it mean if the p-value is in the range of 0.05 to 0.1?
-A p-value in the range of 0.05 to 0.1 suggests mild evidence against the null hypothesis, which is less convincing than a p-value less than 0.05.
What is the implication of a p-value greater than 0.1?
-A p-value greater than 0.1 implies that there is no significant evidence against the null hypothesis, and it is typically accepted in this case.
How does the process of hypothesis testing help in data science?
-Hypothesis testing provides a structured and statistical approach to validate or refute assumptions about data. It helps in making informed decisions by quantifying the likelihood that observed results occurred by chance alone.
Outlines
📊 Understanding P-values and Hypothesis Testing
In this first paragraph, Aman, a data scientist, introduces the concepts of p-values and hypothesis testing. He explains that a p-value is the probability of the null hypothesis being true, which is an assumption that treats all conditions as equal. Using the example of global GDP before and after a pandemic, Aman illustrates how the null hypothesis can be tested and potentially disproven with data. He also mentions the significance level, commonly set at 0.05, which indicates the threshold for rejecting the null hypothesis. Aman promises to simplify these concepts for viewers and sets the stage for further discussion on hypothesis testing.
🔍 Hypothesis Testing Process and Significance Levels
The second paragraph delves into the process of hypothesis testing, which involves collecting data and defining a significance level to make a decision about the null hypothesis. Aman discusses the common significance level of 0.05, explaining that if the null hypothesis holds true for 5% of cases, it is generally rejected. He further clarifies the meaning of accepting or rejecting the null hypothesis and introduces the concepts of the null hypothesis (H₀) and the alternate hypothesis (H₁). Aman also lists various statistical tests such as t-test, chi-squared test, ANOVA, and z-test that are used to calculate p-values. He emphasizes the importance of interpreting the p-value in the context of the significance level and outlines how different p-value ranges indicate varying strengths of evidence against the null hypothesis.
📈 Statistical Tests and Interpreting P-values
In the final paragraph, Aman briefly mentions that he will cover the specific statistical tests used to obtain p-values in upcoming videos. He stresses the importance of understanding how to interpret p-values and choose the right tests for different data and scenarios. Aman encourages viewers to comment with questions and promises to address each test individually in future videos. He concludes by asking viewers to like the video if they found it helpful and bids them farewell until the next video, reminding everyone to stay safe.
Mindmap
Keywords
💡P-value
💡Hypothesis Testing
💡Null Hypothesis
💡Significance Level
💡Alternate Hypothesis
💡Statistical Tests
💡Data Collection
💡Type I Error
💡Confidence Level
💡T-test
💡Chi-Squared Test
Highlights
P-value is defined as the probability of the null hypothesis being true.
The null hypothesis is an assumption that treats all situations as equal and similar.
An example of a null hypothesis is assuming that the global GDP before and after a pandemic is the same.
Hypothesis testing involves using data to prove or disprove a null hypothesis.
The significance level, often set at 0.05, determines the threshold for accepting or rejecting the null hypothesis.
If the p-value is less than the significance level, it indicates strong evidence against the null hypothesis.
Different statistical tests like t-test, chi-squared test, ANOVA, and z-test are used to obtain the p-value.
A p-value less than 0.01 provides a very strong case against the null hypothesis.
A p-value between 0.01 and 0.05 indicates strong evidence against the null hypothesis.
A p-value between 0.05 and 0.1 suggests mild evidence against the null hypothesis.
A p-value greater than 0.1 indicates no evidence against the null hypothesis, and it is accepted.
The process of hypothesis testing includes collecting data, defining a significance level, and performing statistical tests.
The choice of statistical test depends on the type of data and the scenario.
Understanding the p-value and hypothesis testing is crucial for data scientists to draw valid conclusions from data.
The video promises to cover various statistical tests in upcoming videos and their appropriate use cases.
The presenter encourages viewers to comment with doubts and likes for the video to support the content.
Stay safe and take care message signifies the end of the video and a reminder of the ongoing pandemic situation.
Transcripts
Browse More Related Video

p-value - easily explained with an example

Statistical Significance and p-Values Explained Intuitively
Null Hypothesis, p-Value, Statistical Significance, Type 1 Error and Type 2 Error

What is p-value? How we decide on our confidence level.

05 - Using P-Values in Hypothesis Testing (Compare P Value to Level of Significance)

P-values and significance tests | AP Statistics | Khan Academy
5.0 / 5 (0 votes)
Thanks for rating: