AP Calculus Exam Tip: Definite Integral of Absolute Value Function
TLDRThis video script discusses a common type of question found in the multiple-choice section of the AP exam, which involves integrating an absolute value function. The presenter suggests a straightforward approach to solving these problems by first graphing the function to identify key points. Two examples are provided to illustrate the method. In the first example, the integral from zero to three of the absolute value of (X - 1) is calculated by graphing the function, finding the vertex at X=1, and then calculating the areas of two regions formed by the graph. The second example involves the integral from negative two to five of the absolute value of (X + 1), where the vertex is at X=-1, and again, the areas of two triangular regions are summed to find the integral. The presenter emphasizes that this graphical method avoids dealing with piecewise functions and is the easiest way to approach these problems. The video concludes with a summary that encourages viewers to use this method for integrating absolute values of linear functions and wishes them good luck.
Takeaways
- 📈 **Graphing Integrals**: When dealing with the integral of an absolute value function, start by graphing the function to visualize the areas to be integrated.
- 📌 **Key Points Identification**: Identify the vertex and the points where the function intersects the x-axis, as these are crucial for determining the shape of the graph.
- 🔲 **Absolute Value Interpretation**: Understand that the absolute value function will create a V-shape, with the vertex at the point where the expression inside the absolute value equals zero.
- 🔺 **Areas Calculation**: The definite integral of the absolute value function is found by calculating the areas of the resulting geometric shapes, typically triangles or rectangles.
- 🔽 **Handling Endpoints**: Evaluate the function at the endpoints of the integral to find the necessary points on the graph.
- 🔳 **Piecewise Simplification**: Dealing with absolute value integrals in this graphical manner avoids the complexity of piecewise functions.
- 🧩 **Summation of Triangles**: The areas under the absolute value function typically form triangles, and the integral is the sum of these areas.
- 📐 **Base and Height for Triangles**: For triangles formed under the graph, use the base and height to calculate the area as (1/2) * base * height.
- 🔴 **Special Case Awareness**: Be aware that the areas might not always form perfect squares or rectangles; the shape depends on the specific function.
- 🚫 **Avoiding Mistakes**: Ensure not to make common mistakes, such as incorrectly calculating the base or height of the triangle formed under the graph.
- ✅ **Method Recommendation**: The speaker recommends this graphical approach as the easiest way to deal with integrals of absolute value functions, especially on exams like the AP exam.
Q & A
What is the main topic of the video?
-The video is about how to take the integral of an absolute value function, which is a common type of question in the multiple-choice section of the AP exam.
Why is it important to graph the function when dealing with the integral of an absolute value?
-Graphing the function helps to visualize the regions under the curve and allows for easier calculation of the integral by breaking it down into simpler geometric shapes like triangles or squares.
What are the three key points needed to graph the absolute value function of the form |x - a|?
-The three key points are the vertex of the function at x = a, the point where x = 0 (to determine the value of the function at the start of the integration interval), and the endpoint of the integration interval.
How does the graph of the absolute value function |x - 1| look like?
-The graph of |x - 1| has a vertex at x = 1, a point at (0, 1) when x = 0, and a point at (3, 2) when x = 3, forming a V-shape that opens to the right.
What is the method to find the definite integral of |x - 1| from 0 to 3?
-The method involves finding the areas of the two regions formed under the graph of |x - 1| between x = 0 and x = 3. The integral is the sum of half of a 1x1 square (1/2) and half of a 2x2 square (2), which equals 5/2.
Why is it recommended to avoid dealing with piecewise functions when integrating absolute values?
-Dealing with piecewise functions can complicate the integration process. By graphing and using geometric shapes, the integration becomes more straightforward and less prone to errors.
What is the integral of |x + 1| from -2 to 5?
-The integral is found by calculating the areas of two triangles formed under the graph of |x + 1| between x = -2 and x = 5. The sum of half of a 1x1 square (1/2) and half of a 6x6 square (18) equals 37/2.
How does the graph of the absolute value function |x + 1| differ from that of |x - 1|?
-The graph of |x + 1| has a vertex at x = -1, a point at (-2, 1) when x = -2, and a point at (5, 6) when x = 5, forming a V-shape that opens to the left.
What is the key takeaway from the video for dealing with the integral of an absolute value of a linear function?
-The key takeaway is to graph the function to identify the regions under the curve, then calculate the integral by summing up the areas of the resulting geometric shapes, typically triangles or squares.
What is the advantage of using the graphical method for calculating the integral of an absolute value function?
-The graphical method simplifies the calculation by avoiding complex piecewise function analysis and instead uses basic geometry to find the areas under the curve.
How does the video help students prepare for the AP exam?
-The video provides a clear, step-by-step approach to solving a common type of problem on the AP exam, enhancing students' understanding and ability to tackle similar questions on the test.
What is the significance of identifying the vertex and endpoints in the integral of an absolute value function?
-Identifying the vertex and endpoints is crucial as they define the key points on the graph of the absolute value function, which are then used to determine the regions for calculating the integral.
Why is it important to consider the value of the function at the start of the integration interval (x = 0)?
-Considering the value of the function at x = 0 is important because it helps determine the starting point of the graph and ensures that the entire region under the curve within the integration interval is included in the calculation.
Outlines
📚 Understanding Absolute Value Integrals on AP Exam
This paragraph introduces the topic of the video, which is to explain how to handle the integration of absolute value functions in the multiple-choice section of the AP exam. The speaker plans to demonstrate this with two examples, emphasizing a method that avoids dealing with piecewise functions and simplifies the process.
Mindmap
Keywords
💡Absolute Value Function
💡Integral
💡Multiple-Choice Section
💡Graph
💡Vertex
💡Definite Integral
💡Piecewise Functions
💡Area Calculation
💡Linear Function
💡AP Exam
💡Triangle Area
Highlights
The video discusses how to integrate absolute value functions, a common type of question on the AP exam.
Two examples are provided to demonstrate the process for integrating absolute value functions.
The first example involves integrating the absolute value of (x - 1) from 0 to 3.
The importance of identifying key points on the graph of the absolute value function is emphasized.
The vertex of the absolute value function is at x = 1 for the first example.
The function's values at x = 0 and x = 3 are calculated to determine additional points on the graph.
The definite integral is found by summing the areas of the regions formed under the graph.
The first integral's result is obtained by adding areas of half a 1x1 square and half a 2x2 square.
The second example involves integrating the absolute value of (x + 1) from -2 to 5.
The vertex for the second function is at x = -1, determined by setting the expression inside the absolute value to zero.
Points on the graph are identified for x = -2, x = 0, and x = 5.
The integral of the second example results in the sum of the areas of two triangles.
The areas are calculated as half of a 1x1 square and half of a 6x6 square.
The final answer for the second integral is 37/2, avoiding piecewise function complications.
The presenter recommends graphing and summing triangles as the easiest method to integrate absolute value functions.
Piecewise functions are not required in this approach, simplifying the integration process.
The method is practical and applicable to a variety of absolute value function integration problems.
The video concludes with a summary of the method and well wishes for the viewers' success.
Transcripts
Browse More Related Video
Definite Integrals from Graphs (Part 3 of 3) - Absolute Value
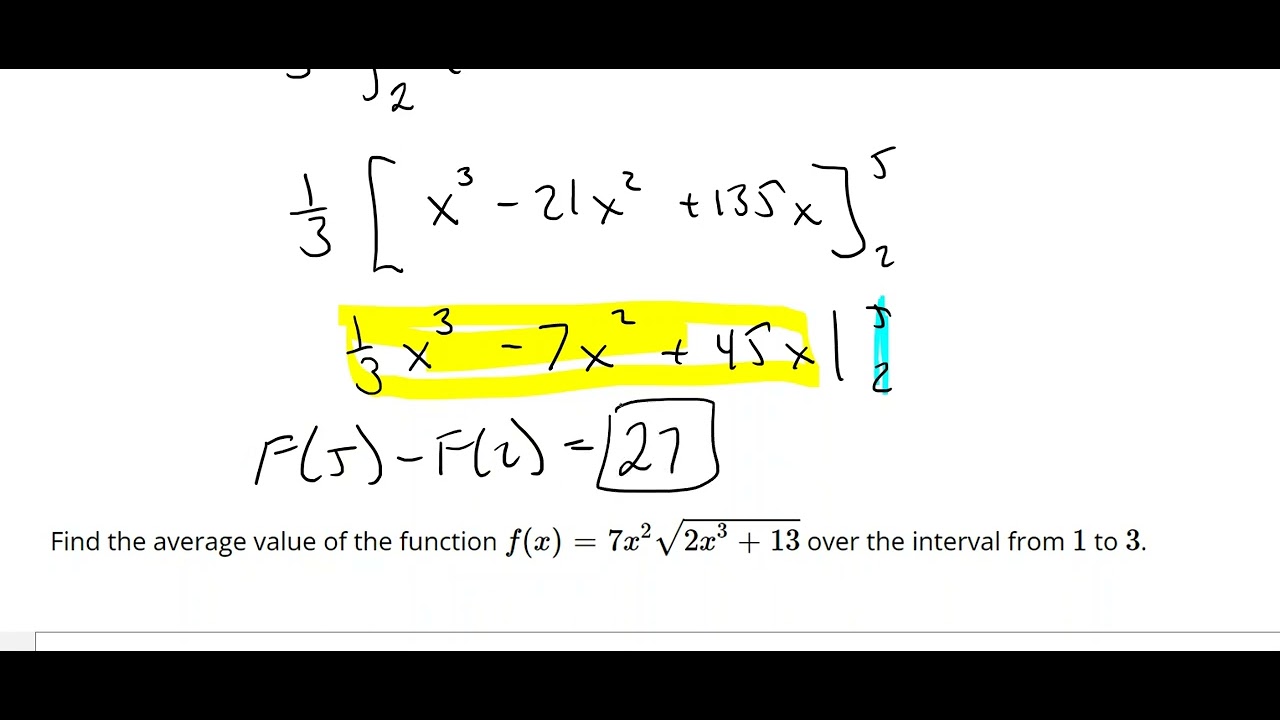
Average Value of a Function
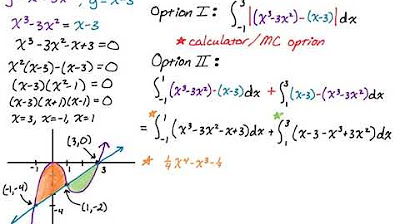
Area Between Two Curves with Multiple Regions: y = x^3-3x^2 and y = x-3
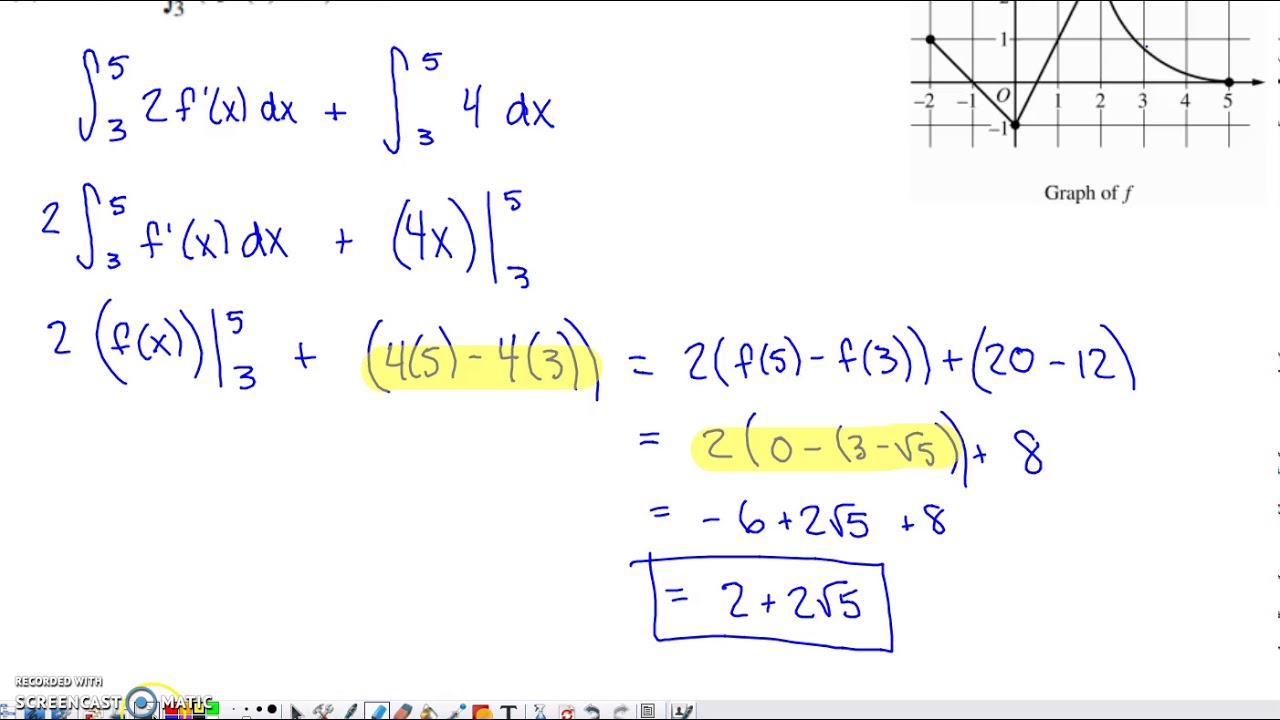
2019 AP Calculus AB & BC Free Response Question #3
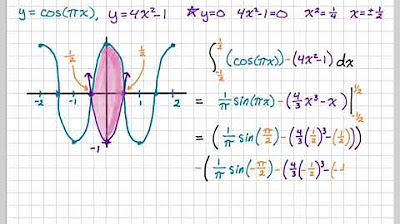
Area Between Curves: y = cos(pi*x), y = 4x^2 -1

AP Calculus Exam Tip: Absolute Value of x over x, abs(x)/x
5.0 / 5 (0 votes)
Thanks for rating: