Reliability analysis : How to obtain Cronbach Alpha value in SPSS
TLDRIn this informative video, the host, Mithu, delves into the concept of reliability analysis, a statistical method essential for assessing the consistency and stability of a measurement tool, particularly questionnaires. The video introduces Cronbach's Alpha, a key metric for determining the internal consistency of a questionnaire. Using SPSS, viewers learn how to perform a reliability analysis, interpret the output, and understand the implications of the Alpha value. A low Alpha score, as demonstrated with a sample dataset, indicates potential issues with the questionnaire's design. The host suggests several strategies for improving the Alpha value, including clarifying questions, increasing the number of questions and observations, and revising the style of questioning. This video is an excellent primer for anyone looking to enhance the reliability of their survey instruments.
Takeaways
- 📊 **Reliability Analysis Definition**: It's a statistical method used to evaluate the consistency and stability of a measurement tool, such as a questionnaire.
- 📝 **Chronbach's Alpha**: This is a statistical measure that assesses the consistency of a questionnaire, indicating its reliability.
- 🔍 **Interpreting Alpha Values**: An Alpha value greater than 0.7 suggests internal consistency and reliability, while a value less than 0.7 indicates potential issues with the questionnaire.
- 📉 **Negative Alpha Values**: Rarely, an Alpha value can be negative, often due to reverse-coded questions in the questionnaire.
- 📚 **SPSS for Reliability Analysis**: SPSS provides various methods, including Chronbach's Alpha, to evaluate the reliability of questionnaires.
- 🧐 **Improving Reliability**: To increase the Alpha value, consider clarifying questions, increasing the number of questions or observations, and rewording unclear questions.
- 🔢 **Ordinal Data Type**: The variables in the dataset should be of ordinal scale for accurate reliability analysis.
- 📋 **Descriptive Statistics**: Mean values and standard deviations of items can provide insights into why the Alpha value may be low.
- 🔄 **Re-evaluation**: If the Alpha value is low, it may be necessary to revisit the style of questioning and make appropriate changes.
- ❗ **Clear Instructions**: Unclear or ambiguous questions can lead to a low Alpha value, emphasizing the need for clear instructions.
- 📈 **Future Steps**: The presenter plans to create another video discussing steps to improve the Alpha value, addressing the issues found in the current analysis.
Q & A
What is the main topic of the video?
-The main topic of the video is reliability analysis, a statistical method used to evaluate the consistency and stability of a measurement tool, particularly focusing on questionnaires.
What is Cronbach's alpha?
-Cronbach's alpha is a statistical measure used to assess the internal consistency of a questionnaire. It indicates how consistently the items in the questionnaire measure the same underlying construct.
How is Cronbach's alpha interpreted?
-Cronbach's alpha value ranges between 0 and 1. If the value is greater than 0.7, it suggests good internal consistency among the questionnaire items. Conversely, if the value is less than 0.7, it indicates poor consistency and unreliability.
What are some methods provided by SPSS for evaluating reliability?
-SPSS provides various methods for evaluating reliability, including Cronbach's alpha, inter-item correlation, and item-total correlation.
What can cause a low Cronbach's alpha value?
-Several factors can lead to a low Cronbach's alpha value, such as unclear or ambiguous questions, insufficient number of questions or observations, and the need for revising or rewording questions to improve clarity.
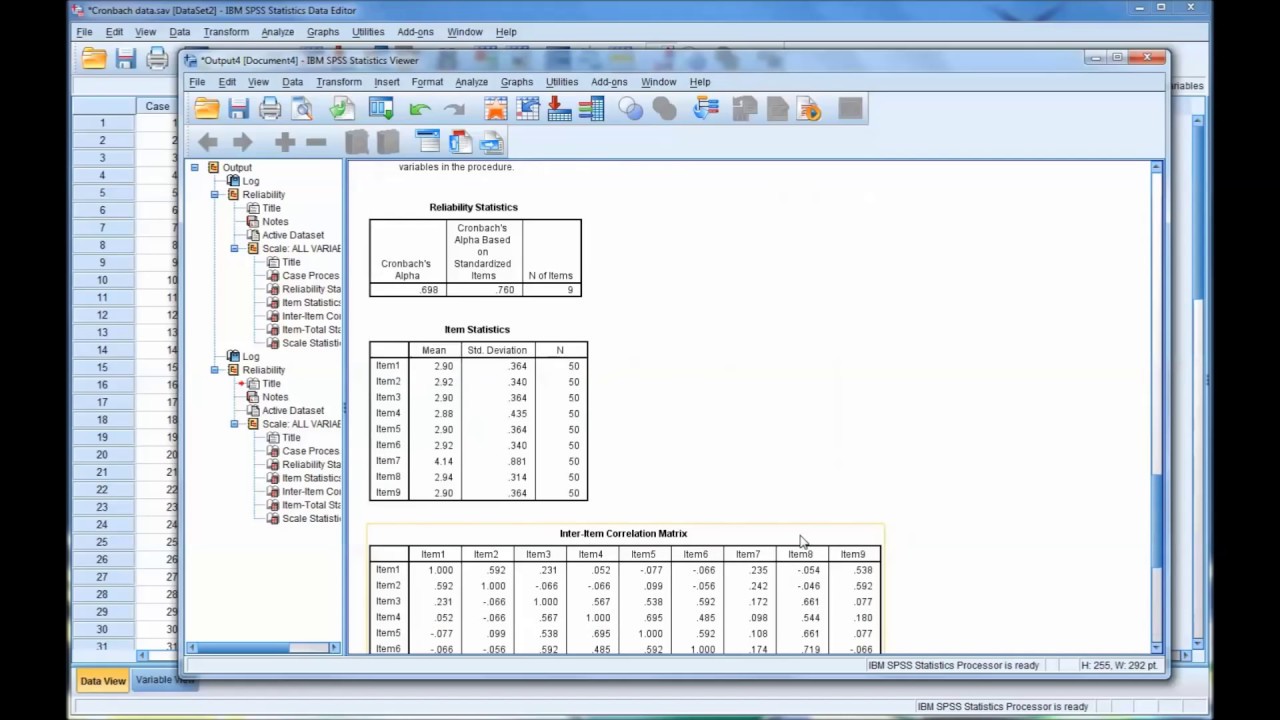
How does SPSS assist in interpreting Cronbach's alpha?
-SPSS provides a short description of Cronbach's alpha along with the computed value. Additionally, users can double-click on the alpha value to access a dialog box that offers further explanation of the measure.
What is the significance of a sample size in reliability analysis?
-The sample size indicates the number of observations used in calculating Cronbach's alpha. A larger sample size generally leads to more reliable results.
How can one perform reliability analysis using SPSS?
-To perform reliability analysis in SPSS, one can go to the 'analyze' menu, choose 'scale,' then select 'reliability analysis.' Subsequently, the questionnaire items are added, and the desired reliability measures are selected before executing the analysis.
What does it mean when one of the questions is reverse-coded?
-Reverse coding refers to the process of assigning values to questionnaire items in a way that reverses the scoring of some questions. This may result in a negative Cronbach's alpha value under certain circumstances.
What steps can be taken to improve a low Cronbach's alpha value?
-To improve a low Cronbach's alpha value, steps such as clarifying instructions, increasing the number of questions or observations, revising unclear questions, and re-evaluating the questioning style can be undertaken.
Outlines
😀 Introduction to Reliability Analysis
In this paragraph, the speaker introduces the topic of reliability analysis. They explain that reliability analysis is a statistical method used to evaluate the consistency and stability of a measurement tool, particularly focusing on questionnaires. SPSS (Statistical Package for the Social Sciences) offers various methods for evaluating reliability, with one popular method being Cronbach's Alpha. The paragraph also touches on the importance of reliability analysis and encourages viewers to subscribe to the channel.
😃 Understanding Measurement Tools and Variables
This paragraph delves into the concept of measurement tools, specifically focusing on the questionnaire used for reliability analysis. The speaker discusses the type of variables used in the questionnaire (ordinal) and explains how to view variable details in SPSS. They then proceed to initiate a reliability analysis in SPSS, demonstrating how to select variables and interpret the results.
🔍 Interpreting Cronbach's Alpha
Here, the speaker explains Cronbach's Alpha, emphasizing its role as a measure of internal consistency in a questionnaire. They guide viewers through the interpretation of Cronbach's Alpha values, highlighting that a value greater than 0.7 indicates high internal consistency, while a value below 0.7 signifies low reliability. The paragraph concludes with insights into troubleshooting low Cronbach's Alpha values and hints at future content about improving reliability.
📊 SPSS Features for Interpretation
In this paragraph, the speaker demonstrates SPSS features for interpreting Cronbach's Alpha values. They show how SPSS provides descriptions of statistical measures, such as Cronbach's Alpha, aiding viewers in understanding the results. Additionally, the paragraph discusses descriptive statistics provided by SPSS and hints at future videos focusing on improving reliability through questionnaire refinement.
📝 Tips for Improving Reliability
The final paragraph offers practical tips for improving reliability in questionnaires. The speaker suggests steps such as clarifying instructions, increasing the number of questions, revising unclear questions, and evaluating the questioning style. They emphasize the importance of addressing issues to enhance the reliability of data. The paragraph concludes with a call to action, encouraging viewers to like, share, and subscribe.
Mindmap
Keywords
💡Reliability Analysis
💡Chronbach's Alpha
💡SPSS
💡Internal Consistency
💡Inter-item Correlation
💡Item-total Correlation
💡Ordinal Variables
💡Sample Size
💡Descriptive Statistics
💡Pilot Test
💡Questionnaire Design
Highlights
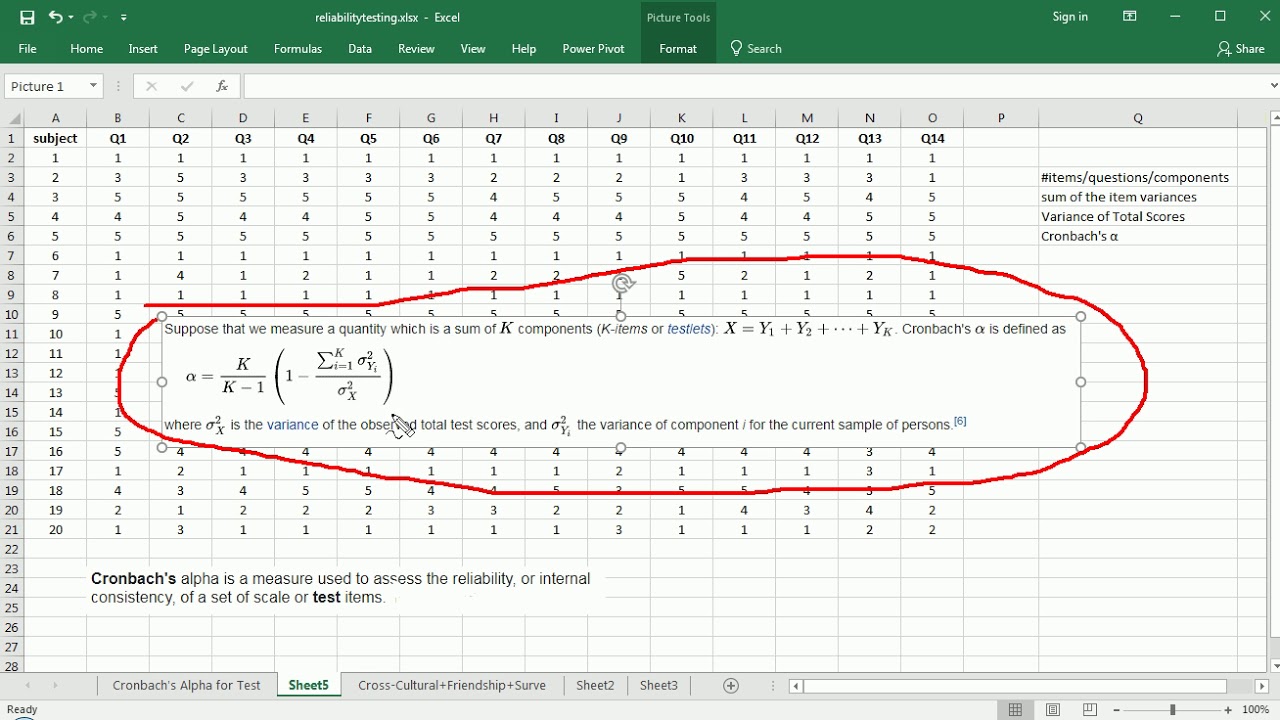
Reliability analysis is a statistical method used to evaluate the consistency and stability of a measurement tool, such as a questionnaire.
Chronbach's alpha is a statistical measure that indicates the consistency of a questionnaire.
SPSS provides various methods for evaluating reliability, including Cronbach's alpha, inter-item correlation, and item-total correlation.
To perform Cronbach's alpha, a data set must be imported into SPSS and the questions selected for analysis.
The sample size for the analysis was 328 observations.
Cronbach's alpha values typically range between 0 and 1, with higher values indicating greater internal consistency.
A Cronbach's alpha value greater than 0.7 suggests internal consistency among the questions.
An alpha value less than 0.7 indicates that the questionnaire is not consistent and not reliable.
SPSS offers a descriptive explanation of Cronbach's alpha, including its computation and interpretation.
Descriptive statistics such as mean values and standard deviations for each item can provide insights into the questionnaire's reliability.
Low Cronbach's alpha values may suggest unclear questions, insufficient question clarity, or a need for more observations.
Increasing the number of questions or observations, or revising unclear questions can improve Cronbach's alpha.
The style of questioning should be re-evaluated before finalizing the questionnaire to ensure reliability.
A future video will discuss steps to improve Cronbach's alpha value.
The video concludes with the importance of a Cronbach's alpha value greater than 0.7 for reliable questionnaires.
If Cronbach's alpha is less than 0.7, it signals potential issues with the questionnaire's design and reliability.
The video provides a comprehensive guide on performing and interpreting reliability analysis using SPSS.
Transcripts
Browse More Related Video
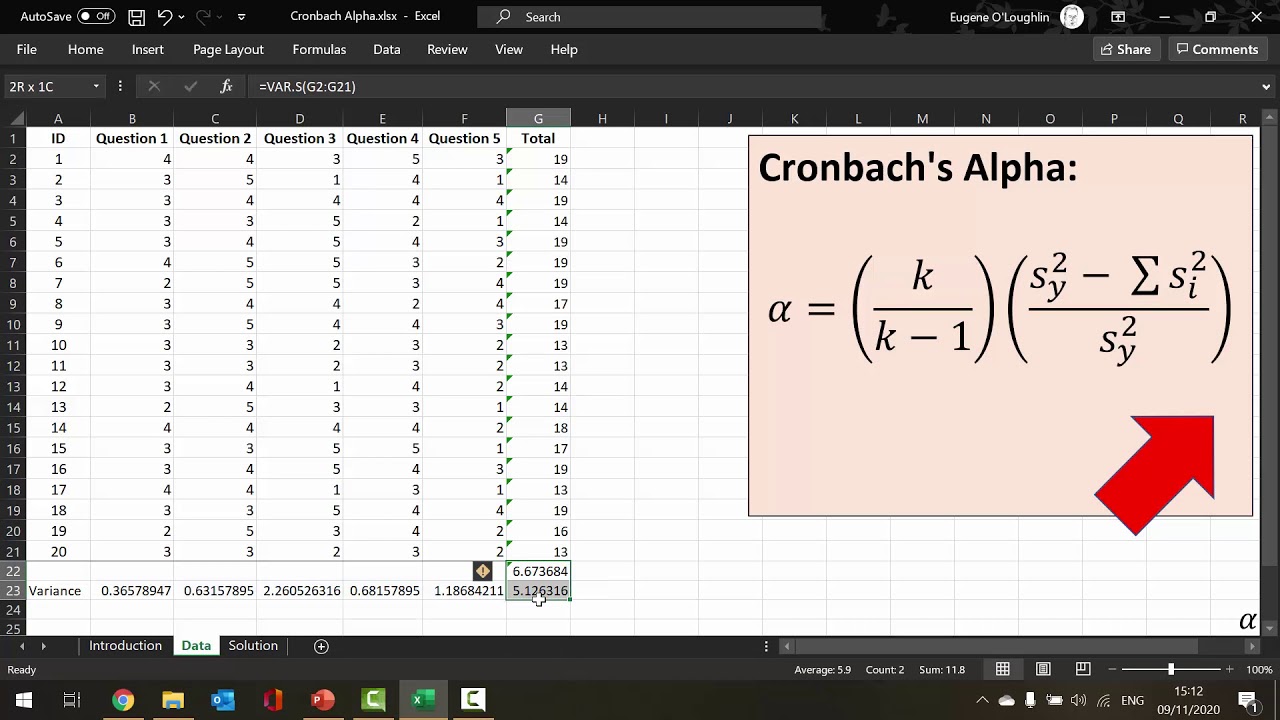
How To... Calculate Cronbach's Alpha in Excel
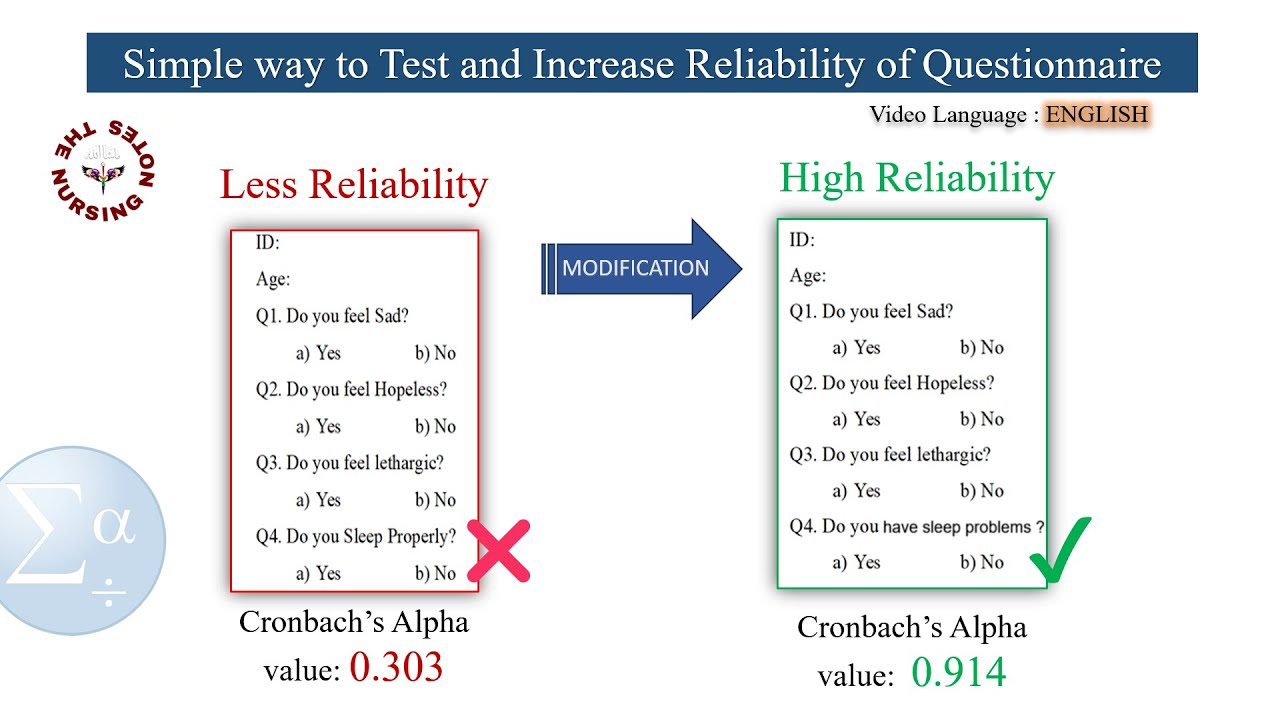
Mastering to Increase Cronbach's alpha value | Reliability Test | Simple| using SPSS
Calculating and Interpreting Cronbach's Alpha Using SPSS
Cronbach's Alpha - Excel

Cronbach's alpha or Coefficient alpha in simple language - DU Professor

Cronbach's Alpha (Simply explained)
5.0 / 5 (0 votes)
Thanks for rating: