Graphing Algebraic Functions: Domain and Range, Maxima and Minima
TLDRThe script discusses graphing functions, building on previous algebraic concepts. It explains that graphing shows the relationship between x and y values visually. Beyond lines, it introduces graphing higher degree polynomial functions like parabolas and cubes, contrasting their shapes. It distinguishes between odd and even functions based on the exponent. Other key concepts covered include domain, range, asymptotes, relative maxima and minima. The goal is to provide foundational knowledge about graphing functions to apply later for more advanced algebraic concepts.
Takeaways
- 😀 Graphing functions visually represents a table of ordered pairs (x, y)
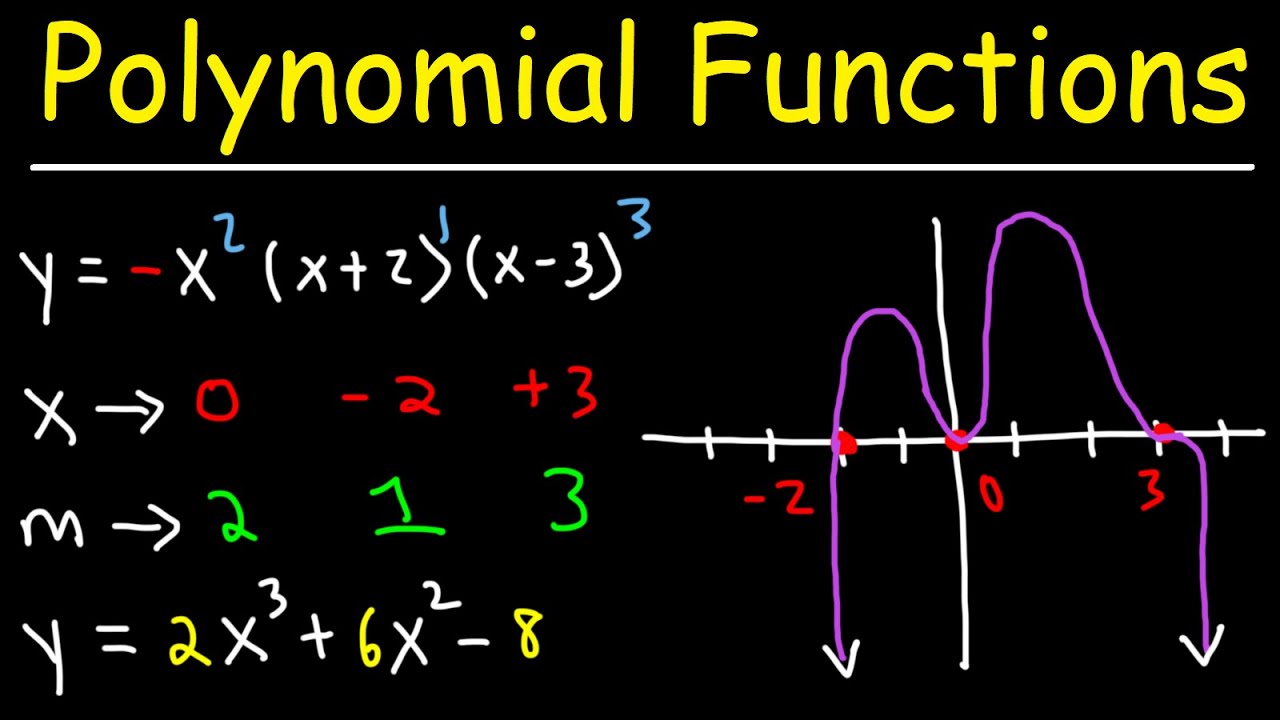
- 😉 Higher degree polynomial functions like x^2 and x^3 have distinctive graphical shapes
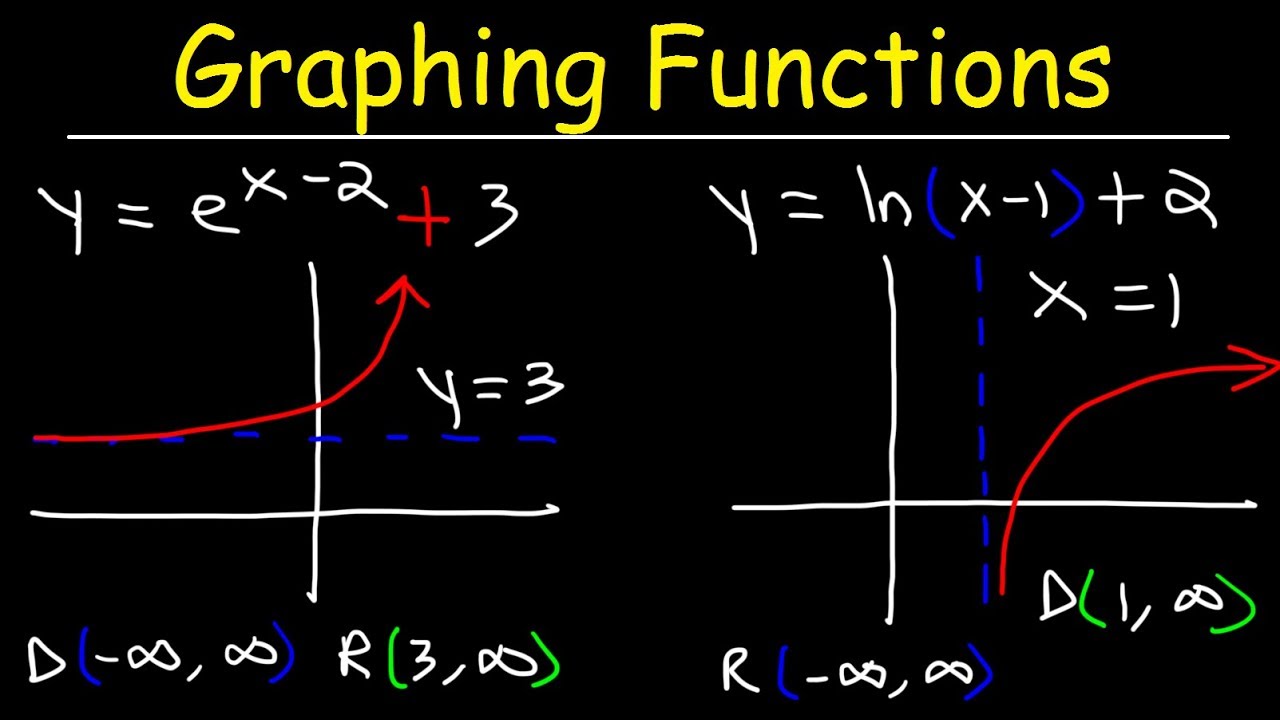
- 🧐 The domain is the set of allowed x-values; the range is the set of allowed y-values
- 🤓 Polynomials with an odd exponent are odd functions; even exponents give even functions
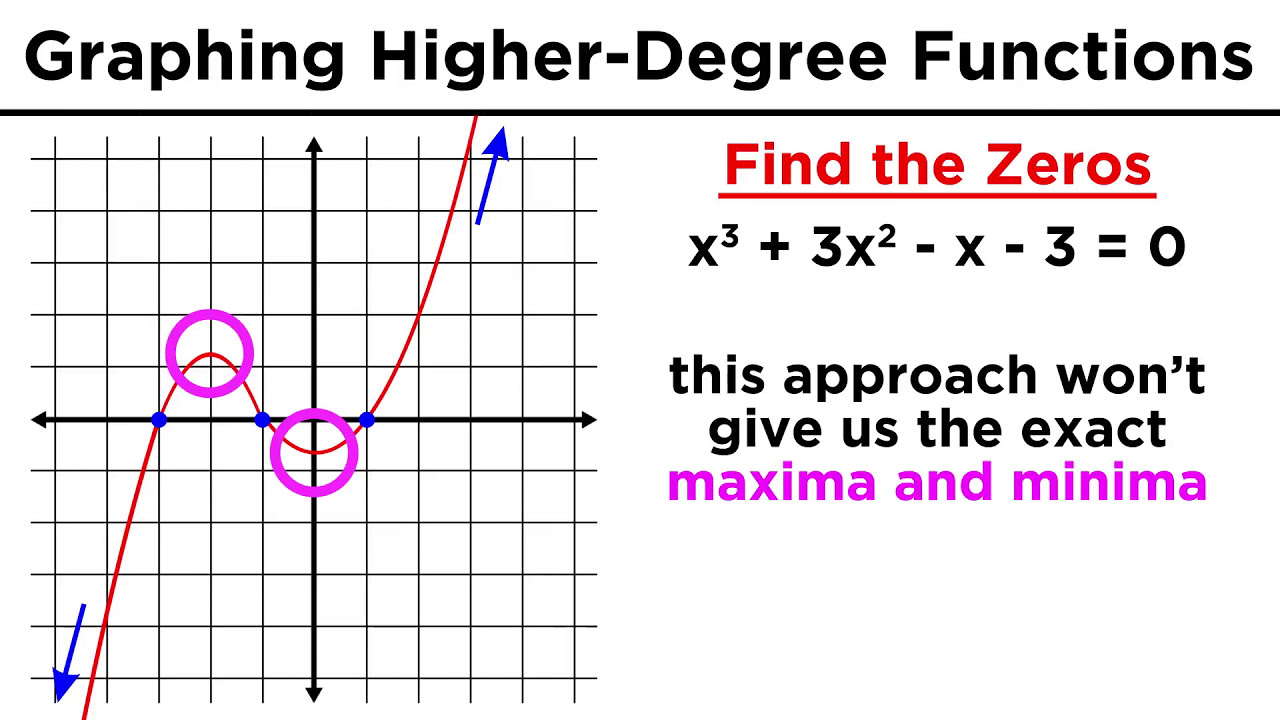
- 😮 Relative maxima and minima identify hills and valleys in a graphed function
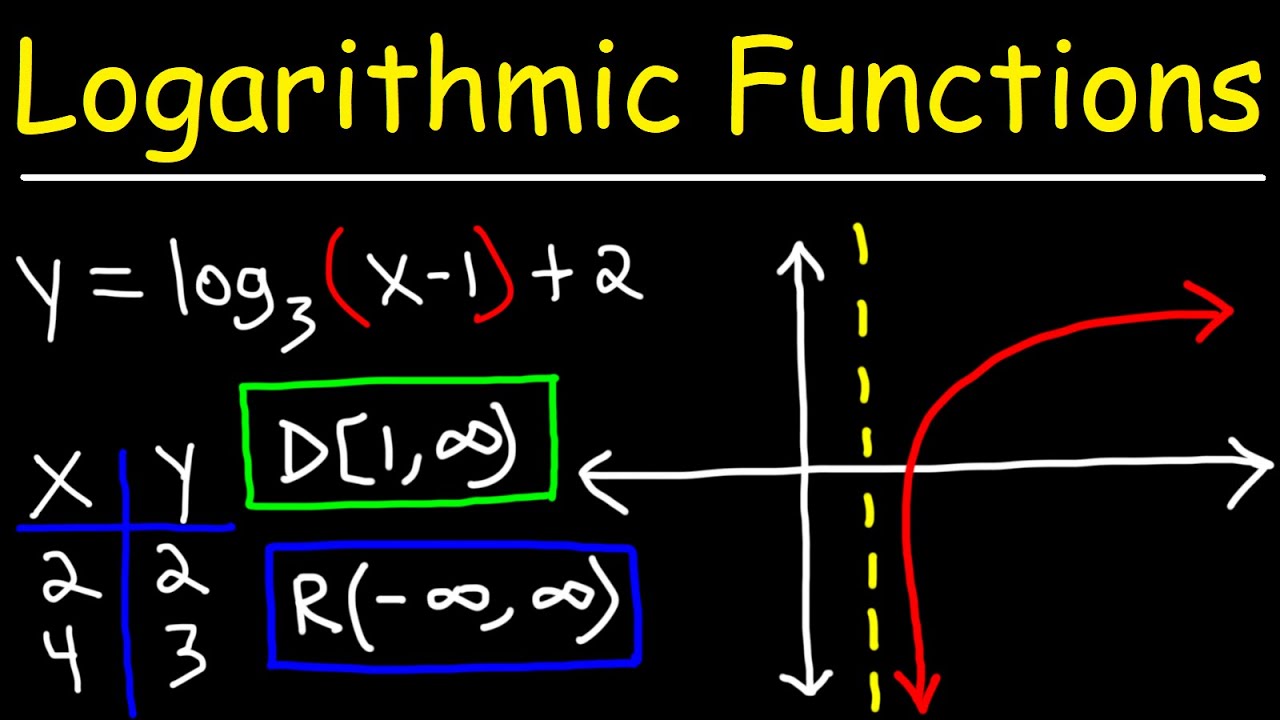
- 👍 Asymptotes represent missing or undefined values where the function approaches infinity
- 📈 The function's shape and range depend on the specific equation used
- 😊 Graphing transforms equations into visual representations
- 🤔 Restricted domains exclude certain x-values like division by zero
- 📉 Vertical lines have only one x-value in their domain
Q & A
What are the key components needed to graph a function?
-To graph a function, you need a set of ordered pairs consisting of x values (inputs) and corresponding y or f(x) values (outputs). Plotting these ordered pairs visually represents the function.
How does graphing a parabola differ from graphing a straight line?
-A parabola is a quadratic function, meaning it has an x term raised to the 2nd power. This causes the slope of the parabola to continuously increase, forming a curved U or inverted U shape, unlike a straight line with constant slope.
What is meant by odd and even functions when graphing polynomials?
-Polynomials with odd exponents like x^3 are called odd functions - they are symmetrical about the origin. Even exponent polynomials like x^2 are called even functions - the right side mirrors the left side.
What does the domain of a function represent?
-The domain represents the set of all valid x-values that can be input into the function.
What causes a function to have asymptotes?
-Asymptotes occur when certain x-values make the function undefined, typically due to division by zero. As the function approaches these missing x-values, it tends towards positive or negative infinity.
How can the range of possible outputs of a function be determined?
-The range represents the set of all possible resulting y or f(x) values. Analyzing the function equation and its graph provides insight into the minimum and maximum bounds for the range.
What are relative maxima and minima in reference to function graphs?
-Relative maxima are peaks or high points where the function transitions from increasing to decreasing. Relative minima are valleys or low points where it transitions from decreasing to increasing.
What causes vertical asymptotes on function graphs?
-Vertical asymptotes occur when there is a missing x-value in the domain that makes the function undefined. As x approaches this missing value, the curve will get closer and closer to infinity.
How can higher degree polynomial functions be identified from their graphs?
-The degree of the polynomial determines the general shape - quadratics with x^2 give parabolas, cubics with x^3 give S-curves, quartics with x^4 give wigglier parabolas. Higher degrees create more fluctuations.
Why are concepts like maxima, minima, and asymptotes important when analyzing functions?
-These features provide insight into the behavior of the function - its increasing/decreasing nature, bounds for the range, and any exceptions or holes in the domain. Together they characterize how the function will respond to different input values.
Outlines
😀 Introducing Graphing Functions
This paragraph provides an introduction to graphing functions. It explains that graphing a function is similar to creating a table of x and y value pairs. It also mentions reviewing earlier algebra concepts and introduces discussing more advanced graphing topics like higher degree polynomials and parabolas.
😃 Key Properties of Graphed Functions
This paragraph explores some key properties of graphed functions. It shows examples of higher degree polynomial functions like x^2, x^3, and x^4. It introduces the concepts of odd and even functions based on the exponent, domain and range of functions, relative maxima and minima, and asymptotes.
Mindmap
Keywords
💡Graphing functions
💡Domain
💡Range
💡Polynomial functions
💡Relative extrema
💡Asymptotes
💡Even and odd functions
💡Ordered pairs
💡Infinity
💡Undefined values
Highlights
Graphing functions is a visual representation of a table of ordered pairs that comprise the function.
Higher degree polynomial functions like parabolas can be graphed and analyzed.
The shape of polynomial functions depends on whether the exponent is odd or even.
The domain is the set of allowed x-values that can be plugged into a function.
Exceptions to an infinite domain occur with vertical lines and asymptotes.
The range is the set of possible values the function can take.
Relative maxima and minima identify hills and valleys in the function.
Graphing functions provides a visual representation of functional behavior.
Higher degree polynomials can model real-world phenomena.
Restrictions on domain avoid undefined outputs like division by zero.
The range depends on the particular form of the function.
Extreme points show where the function changes direction.
Graphs extend knowledge of functions beyond algebraic formulas.
Key aspects include domain, range, shape and extreme points.
Graphing builds intuition and guides analysis of functions.
Transcripts
Browse More Related Video

Graphing Rational Functions with Transformations (Precalculus - College Algebra 39)
How To Graph Polynomial Functions Using End Behavior, Multiplicity & Zeros
Graphing Logarithmic Functions
Graphing Natural logarithmic functions and Exponential Functions
Graphing Higher-Degree Polynomials: The Leading Coefficient Test and Finding Zeros
How to Sketch Polynomial Functions (Precalculus - College Algebra 31)
5.0 / 5 (0 votes)
Thanks for rating: