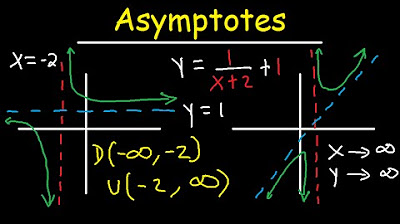
Graphing Rational Functions and Their Asymptotes
TLDRThe video explains how to graph rational functions, which have a polynomial numerator and denominator. Unlike polynomials, rational functions have restricted domains and asymptotes. To graph them, first find vertical asymptotes from the denominator's zeroes. Check if there is a horizontal asymptote by comparing polynomial degrees and leading terms. Plot selective points near asymptotes and as X approaches +/- infinity to reveal overall behavior. Use transformations when applicable. With intercepts and asymptote info, sketching rational functions with real roots becomes straightforward.
Takeaways
- 😀 Rational functions have more complex behavior than polynomials due to denominators creating excluded values
- 📈 Asymptotes are lines or curves that the function approaches but never touches
- 📉 Vertical asymptotes occur where the denominator equals 0
- ⬅️ Horizontal asymptotes can be found by comparing degrees and coefficients of numerator and denominator
- ➡️ Graph rational functions by finding asymptotes and testing points
- 👆 Transformations can be used to graph some rational functions
- ⚖️ Numerators stretch or compress functions vertically
- ⚖️ Denominators shift functions horizontally
- 🌄 Rational functions can cross horizontal asymptotes
- 📒 Strategies: find asymptotes, intercepts, test points to reveal overall behavior
Q & A
What are the two main reasons rational functions can be trickier to graph than polynomials?
-First, it's not as immediately apparent what the behavior of the function will be. Second, the domain will typically not be all real numbers as it was for polynomials, because the denominator can't be zero.
What is represented by the asymptotes of a rational function?
-Asymptotes are lines that the rational function approaches, getting closer and closer, but never quite touching.
How do you find the vertical asymptotes of a rational function?
-Find the vertical asymptotes by finding the zeroes of the denominator polynomial. These values are not included in the domain.
How do you determine if a rational function has a horizontal asymptote?
-Compare the degrees of the numerator and denominator polynomials. If the denominator has a higher degree, the function has a horizontal asymptote at y=0. If they are the same degree, take the ratio of the leading coefficients.
What is the strategy for graphing a rational function?
-Find asymptotes, x- and y-intercepts. Plot selective points near asymptotes and as x approaches +/- infinity to reveal behavior. Connect points to sketch graph.
Can a rational function cross its horizontal asymptote?
-Yes, a rational function can sometimes cross its horizontal asymptote, unlike with vertical asymptotes.
How do transformations apply to graphing rational functions?
-If you know the graph of a basic rational function like 1/x, transformations involving stretches, compressions, and shifts work the same way as with other function types.
What is an advantage of using transformations to graph rational functions?
-Using transformations can be faster than finding asymptotes and plotting points if you recognize a basic rational function that has been transformed.
What is the domain of the function 1/x?
-The domain is all real numbers except for x=0, because 1/0 is undefined.
What are some strategies for selectively picking points to plot when graphing a rational function?
-Pick points near identified asymptotes, pick increasing positive and negative x-values to reveal end behavior, and plug in simple values like 0, 1, and -1.
Outlines
📈 Graphing Rational Functions and Finding Their Asymptotes
This paragraph introduces rational functions, composed of polynomial numerator and denominators. It discusses key challenges in graphing them: unclear behavior and restricted domains. It then outlines the strategy for graphing: finding vertical, horizontal, and angular asymptotes that the function approaches but never reaches.
😊 Applying Transformations to Graph Rational Functions
This paragraph notes that transformations like vertical and horizontal shifts, as well as stretches, can be applied to graph some rational functions more easily. However, when transformations don't apply, the asymptote-based strategy outlined earlier remains effective for sketching graphs.
Mindmap
Keywords
💡rational functions
💡asymptotes
💡domain
💡vertical asymptotes
💡horizontal asymptotes
💡leading terms
💡higher degree polynomial
💡sketching graphs
💡transformations
💡real roots
Highlights
Introduction to graphing rational functions and their asymptotes.
Rational functions are expressed as quotients of polynomial functions.
Graphing rational functions can be tricky due to domain restrictions and behavior analysis.
The domain of rational functions typically excludes values that make the denominator zero.
Example provided of graphing the simplest rational function, 1/x.
Explanation of how to determine the behavior of the function around x=0.
Identification of two asymptotes for the function 1/x: x=0 and y=0.
Asymptotes are lines the function approaches but never touches.
Vertical asymptotes are found by identifying zeroes of the denominator.
Horizontal asymptote determination based on the degree and leading coefficients of the numerator and denominator.
Explanation of conditions for having zero, one, or no horizontal asymptotes.
Graphing strategy involves testing values of x near vertical asymptotes and infinity.
A function can sometimes cross its horizontal asymptote.
Use of transformations for graphing rational functions when applicable.
Comprehensive strategy for graphing rational functions, including finding asymptotes, intercepts, and behavior analysis.
Transcripts
Browse More Related Video

Finding a Horizontal Asymptote of a Rational Function (Precalculus - College Algebra 40)

Horizontal and Vertical Asymptotes - Slant / Oblique - Holes - Rational Function - Domain & Range

Finding an Oblique Asymptote of a Rational Function (Precalculus - College Algebra 41)

How to graph a rational function using 6 steps

Finding the Slant Asymptote

AP Calculus AB - 1.15 Connecting Limits at Infinity and Horizontal Asymptotes
5.0 / 5 (0 votes)
Thanks for rating: