How To... Calculate Cronbach's Alpha in Excel
TLDRIn this informative video, Eugeno Lachlan guides viewers through the process of calculating Cronbach's Alpha for assessing the reliability of a survey, specifically for measuring attitudes towards medical care. Using Excel and a sample dataset of 20 individuals' responses to five questions on a five-point scale, Lachlan demonstrates how to calculate the total variance of scores and the sum of individual question variances. The formula for Cronbach's Alpha is then applied, resulting in a value that indicates the internal consistency of the survey. With a low Alpha value obtained in the example, Lachlan suggests that the survey questions may lack strong correlations and advises revising the questions for better reliability before expanding the survey to a larger audience. The video is a practical tutorial on using Cronbach's Alpha to ensure the validity of survey instruments.
Takeaways
- 📊 **Cronbach's Alpha Calculation**: The video demonstrates how to calculate Cronbach's Alpha for a set of survey questions in Excel, using the Office 365 version.
- 📈 **Pilot Testing**: Before conducting a large survey, it's important to test the survey questions on a small pilot group to ensure the questions are reliable and consistent.
- 🔢 **Scoring System**: The survey questions are rated on a 5-point scale, allowing for a range of responses from very good to very poor.
- 🔗 **Correlation Expectation**: High scores on certain questions are expected to correlate with high scores on similar questions, indicating internal consistency.
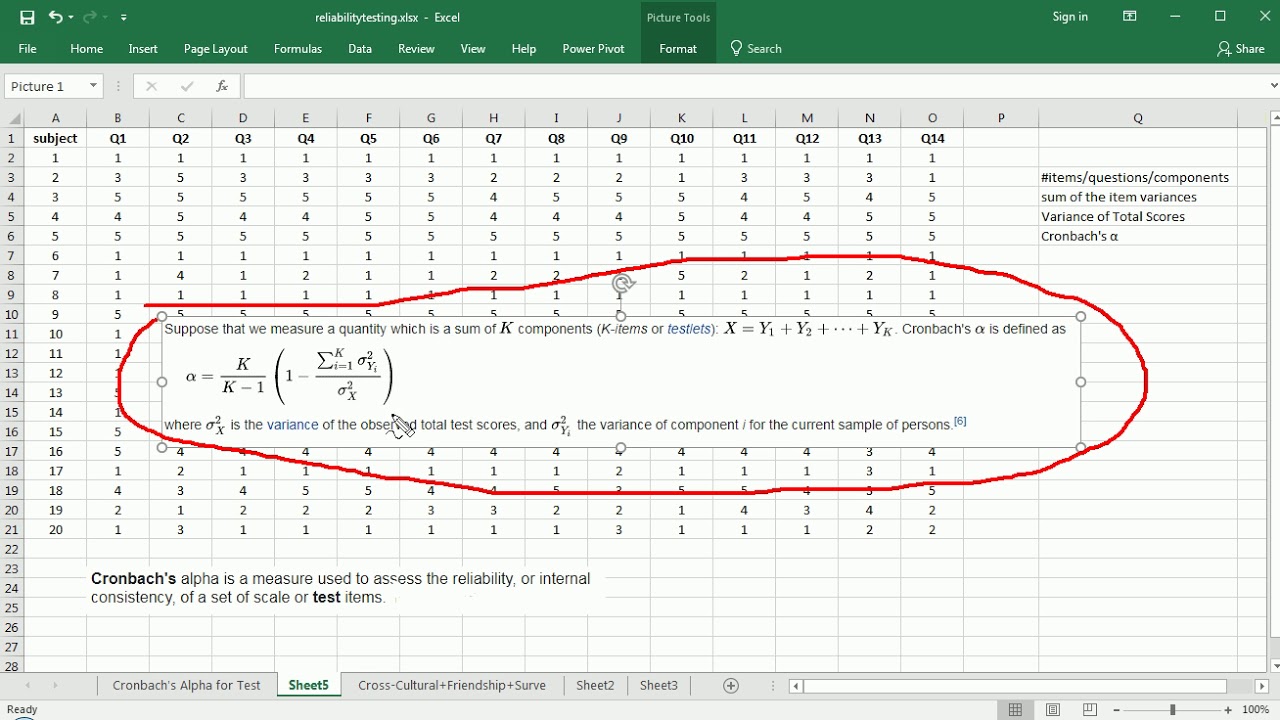
- 📐 **Formula for Cronbach's Alpha**: The formula involves calculating the variance of total scores and individual item variances, which are then used to compute Cronbach's Alpha.
- 📋 **Excel Functions**: The video uses Excel's built-in functions like `VAR.S` to calculate variances, demonstrating the practical application of statistical tools in data analysis.
- 🧮 **Step-by-Step Calculation**: The presenter walks through the process of calculating total scores, variances, and the final Cronbach's Alpha value step by step.
- 🟡 **Interpretation of Results**: A Cronbach's Alpha value close to one indicates high reliability, while a value close to zero suggests low reliability.
- ⚠️ **Low Reliability Action**: If the Cronbach's Alpha value is low, it suggests that the survey questions may need revision, standardization, or possibly the inclusion of more items.
- 🔄 **Revising Questions**: A low Cronbach's Alpha score is a signal to revisit and refine the survey questions before extending the survey to a larger audience.
- 📚 **Educational Content**: The video serves as an educational resource for understanding the concept of internal consistency in survey design and how to apply Cronbach's Alpha in practice.
Q & A
What is the purpose of conducting a Cronbach's alpha test?
-The purpose of conducting a Cronbach's alpha test is to measure the internal consistency and reliability of a set of items or questions in a survey or test. It helps determine if the items correlate well with each other, indicating that they are all measuring the same underlying concept.
What does a high Cronbach's alpha value signify?
-A high Cronbach's alpha value, close to one, signifies that the items in the test or survey are highly consistent with each other. This means that the test is reliable and the items are all measuring the same concept effectively.
What is the formula for calculating Cronbach's alpha?
-The formula for calculating Cronbach's alpha is: α = (K / (K - 1)) * (1 - (Σsi^2) / sy^2), where K is the number of items, Σsi^2 is the sum of the variances of the individual items, and sy^2 is the variance of the total scores.
What does a low Cronbach's alpha value suggest about the survey questions?
-A low Cronbach's alpha value suggests that the survey questions do not correlate well with each other, indicating that the questions may not be reliable or consistent in measuring the intended concept. It could imply that the questions need to be revised or that the survey needs to be improved.
How is the total score for each individual calculated in the context of Cronbach's alpha?
-The total score for each individual is calculated by summing the scores of all the items or questions in the survey. This total score is then used to calculate the variance, which is a component in the Cronbach's alpha formula.
What is the minimum acceptable value for Cronbach's alpha?
-There is no absolute minimum acceptable value for Cronbach's alpha as it depends on the context and the field of study. However, values typically above 0.7 are considered acceptable for group-level research, while values above 0.8 are often desired for individual-level decisions.
What steps can be taken to improve the reliability of a survey if the Cronbach's alpha value is low?
-If the Cronbach's alpha value is low, steps to improve reliability may include revising unclear or ambiguous questions, standardizing instructions, increasing the number of items in the survey, or removing items that do not correlate well with the others.
How does the number of items (K) in a survey affect the Cronbach's alpha calculation?
-The number of items (K) affects the Cronbach's alpha calculation by being part of the formula's denominator. As K increases, the potential for a higher alpha value also increases, assuming the items are consistent. However, simply increasing K without ensuring item relevance and consistency will not improve reliability.
What is the role of variance in calculating Cronbach's alpha?
-Variance plays a crucial role in calculating Cronbach's alpha. The formula uses the variance of the total scores (sy^2) and the sum of the variances of the individual items (Σsi^2). These variances help determine how consistently the items relate to each other and contribute to the overall reliability of the test.
Can Cronbach's alpha be used with a small pilot group?
-Yes, Cronbach's alpha can be used with a small pilot group to test the internal consistency of a survey or set of questions. However, it is important to note that the reliability estimate may not be as stable with a small sample size, and results should be interpreted with caution.
What is the significance of using Excel for calculating Cronbach's alpha as demonstrated in the video?
-Using Excel for calculating Cronbach's alpha allows for easy manipulation of data and formulas. It provides a visual representation of the calculations and results, making it easier to understand and interpret the reliability of the survey questions. Excel's built-in functions for variance and other statistical calculations simplify the process.
Outlines
📊 Introduction to Cronbach's Alpha for Survey Reliability
In this video, Eugeno Lachlan introduces viewers to the concept of Cronbach's Alpha, a statistical measure used to assess the reliability of a set of survey questions. He explains that the test is particularly useful for determining the internal consistency of a survey, which is the degree to which individual items correlate with each other. Lachlan uses an example of a medical care survey with five questions rated on a five-point scale by 20 individuals. He emphasizes the importance of high correlations between items for a reliable survey and outlines the steps to calculate Cronbach's Alpha using Excel, starting with calculating the total scores for each respondent and then determining the variance of these scores.
🧮 Calculating and Interpreting Cronbach's Alpha
Eugeno Lachlan continues the tutorial by demonstrating how to calculate Cronbach's Alpha using Excel. He explains the formula for the calculation, which involves the number of items (k), the variance of total scores (s squared for y), and the sum of the variances for individual items (s squared for i). Lachlan shows how to use Excel functions to compute these values and then substitute them into the formula. The result of the calculation is an alpha value, which is interpreted to assess the reliability of the survey questions. A positive alpha value close to one indicates high reliability, while a value close to zero suggests low reliability. In the example given, the alpha value is low, indicating that the survey questions may not be correlating well and suggesting the need for revision before conducting a larger survey.
Mindmap
Keywords
💡Cronbach's Alpha
💡Liability
💡Excel
💡Office 365
💡
💡Survey Questions
💡Pilot Group
💡Five-Point Scale
💡Internal Consistency
💡Sample Variance
💡Reliability Coefficient
💡Data Analysis
Highlights
Eugeno Lachlan introduces a series of short how-to videos focusing on calculating Cronbach's alpha for liability in Excel.
Cronbach's alpha is used to measure the internal consistency and reliability of a set of survey questions.
The video demonstrates the calculation using a hypothetical survey of medical care with 20 individuals and five questions rated on a five-point scale.
High correlations between item scores indicate higher reliability, which is the goal of Cronbach's alpha.
The formula for calculating Cronbach's alpha is presented, emphasizing the use of variance and the number of items (k).
Excel is used to calculate the total scores for each individual and then the variance of those total scores.
Individual item variances are calculated and summed to contribute to the Cronbach's alpha formula.
The video shows how to use Excel's VAR.S function to calculate variance for both total scores and individual items.
The sum of individual variances is calculated by adding the variances of each question.
Cronbach's alpha is computed using the formula with variance values inserted into the spreadsheet.
The resulting Cronbach's alpha value is 0.289, indicating low reliability of the survey questions.
A low Cronbach's alpha value suggests that the survey questions may not be highly correlated and need revision.
The video recommends revisiting survey questions, standardizing instructions, increasing the number of items, or clarifying ambiguous questions based on the low alpha value.
Cronbach's alpha values close to one indicate higher reliability, while values close to zero indicate low reliability.
The video concludes by emphasizing the importance of revising questions for higher reliability before conducting a larger survey.
Excel's fill handle tool is showcased for copying formulas down a column for efficiency.
The use of brackets in the formula ensures the correct order of operations for accurate calculation.
The video provides a step-by-step guide on how to input and calculate Cronbach's alpha in Excel, making it accessible for viewers with varying levels of statistical knowledge.
Transcripts
Browse More Related Video

Reliability analysis : How to obtain Cronbach Alpha value in SPSS
Cronbach's Alpha - Excel
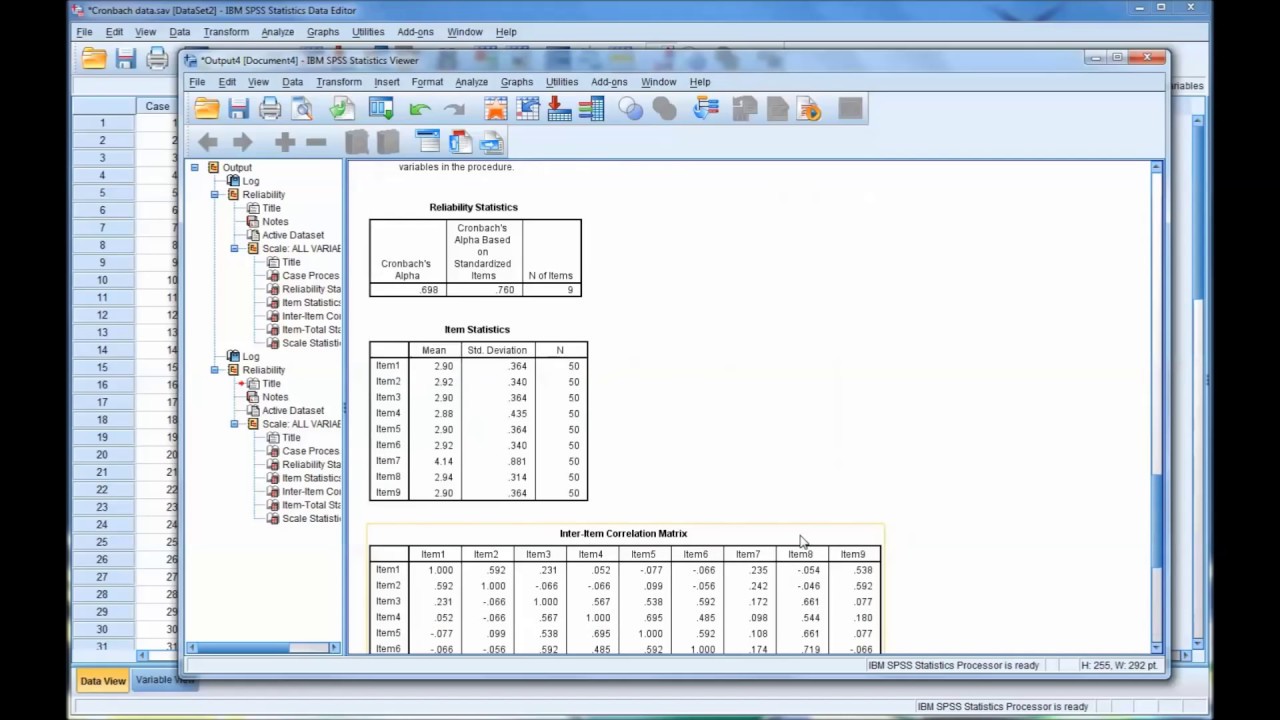
Calculating and Interpreting Cronbach's Alpha Using SPSS

Cronbach's alpha or Coefficient alpha in simple language - DU Professor

What is Cronbach's Alpha? - Explained Simply

What is Cronbach's Alpha? - Explained Simply (Part 2)
5.0 / 5 (0 votes)
Thanks for rating: