Calculating and Interpreting Cronbach's Alpha Using SPSS
TLDRIn this informative video, Dr. Grande explains how to calculate and interpret Cronbach's Alpha, a measure of internal consistency and reliability for a set of items in a scale. Using a dataset with 50 participants and 10 Likert scale items, he demonstrates the process in SPSS, emphasizing that Cronbach's Alpha is suitable for assessing the reliability of multiple items, not just one. The video shows how to perform a reliability analysis, interpret the results, and use the 'alpha if item deleted' statistic to identify items that may improve scale reliability if removed. Dr. Grande also cautions that a high Cronbach's Alpha does not necessarily indicate a single construct and that normal distribution of data can artificially inflate the Alpha score. The video concludes with a practical example of increasing the reliability coefficient by carefully selecting items to retain in the scale.
Takeaways
- 📊 **Cronbach's Alpha Purpose**: Cronbach's alpha is a test used to measure the reliability of a scale, particularly with Likert scales.
- 🔢 **Sample Size**: The example dataset consists of 50 cases with responses to 10 individual items on a Likert scale.
- 📈 **Scale Interpretation**: Cronbach's alpha assesses the reliability of a series of items together, rather than the reliability of a single item.
- 🎯 **Ordinal Assumption**: The script assumes a conservative approach by treating the Likert scale as ordinal for the demonstration.
- 📋 **SPSS Procedure**: To calculate Cronbach's alpha in SPSS, go to Analyze > Scale > Reliability Analysis.
- 📉 **Alpha Interpretation**: A value of 0.7 or higher is generally considered good, while a value around 0.6 is questionable.
- 🔍 **Item Analysis**: The script discusses examining the means, standard deviations, and inter-item correlation matrix to understand item contributions to the scale's reliability.
- ➖ **Item Deletion Impact**: Removing certain items can increase the alpha value, indicating potential scale improvement by item deletion.
- 🔧 **Optimization**: The example shows how removing items 7 and 10 increased the alpha to 0.76, suggesting an optimized scale with 8 items.
- ⚖️ **Caution with Alpha**: High alpha does not necessarily imply unidimensionality; factor analysis is needed to determine the number of constructs.
- ⚠️ **Distribution Impact**: Cronbach's alpha is affected by data distribution, with normally distributed data yielding higher alpha values.
Q & A
What is Cronbach's alpha used for in the context of the given video?
-Cronbach's alpha is used to test the reliability of a scale, particularly when working with Likert scales. It measures the internal consistency of the items that make up the scale.
How many items are included in the scale used in the video example?
-The scale used in the video example includes 10 individual items.
What is the general rule of thumb for interpreting Cronbach's alpha values?
-A Cronbach's alpha value of 0.7 or higher is generally considered good, while a value around 0.6 is considered questionable.
How does the video demonstrate the process of calculating Cronbach's alpha in SPSS?
-The video demonstrates the process by going to 'Analyze', then 'Scale', and then 'Reliability Analysis' in SPSS. It shows how to select the items for analysis and which statistics to choose for a comprehensive evaluation.
What does the 'Item Total Statistics' section of the SPSS output provide?
-The 'Item Total Statistics' section provides information on the correlation of each item with the total scale score, the mean and standard deviation of each item, and the impact on the alpha if an item is deleted.
What does it mean if an item's deletion increases the Cronbach's alpha value?
-If the deletion of an item increases the Cronbach's alpha value, it suggests that the item may not be contributing positively to the reliability of the scale and could potentially be removed.
What is the final Cronbach's alpha value after removing items 7 and 10 from the scale?
-The final Cronbach's alpha value after removing items 7 and 10 is 0.76, which is considered a good reliability coefficient.
Why might a high Cronbach's alpha not necessarily indicate a single construct being measured?
-A high Cronbach's alpha indicates strong internal consistency, but it does not provide information about the dimensionality of the construct(s) being measured. To determine the number of constructs, one would need to use factor analysis.
What is the impact of data distribution on Cronbach's alpha?
-All other factors being constant, a normally distributed dataset will yield a higher Cronbach's alpha than a positively or negatively skewed distribution.
What is the nominal scale and how does it relate to the case number in the video?
-The nominal scale is a level of measurement that categorizes data without implying any order. In the video, the case number is described as nominal, meaning it is a label for identification purposes only.
How does the video suggest improving the reliability of a scale?
-The video suggests improving the reliability of a scale by analyzing the impact of each item on the Cronbach's alpha value and removing items that decrease the alpha when deleted, thereby increasing the overall reliability of the scale.
What cautions does the video provide about the use of Cronbach's alpha?
-The video cautions that Cronbach's alpha should not be used to imply the number of constructs being measured and that high alpha values are more likely with normally distributed data. It also emphasizes that Cronbach's alpha is a measure of internal consistency and not a measure of unidimensionality.
Outlines
📊 Introduction to Cronbach's Alpha for Scale Reliability
Dr. Grande introduces the concept of Cronbach's Alpha, a statistical test used to measure the reliability of a scale. The video uses a dataset in SPSS with 50 participants responding to 10 items on a Likert scale ranging from one to five. The scale's reliability is assessed by considering all items together, as Cronbach's Alpha is not applicable to a single item. The video also discusses the debate over whether a Likert scale should be treated as ordinal or scale data, opting for a conservative approach by treating it as ordinal in the demonstration. The process of calculating Cronbach's Alpha involves going to the 'Analyze' then 'Scale' then 'Reliability Analysis' in SPSS, and selecting the items for analysis while excluding the case number. The default statistics are shown, and the viewer is guided to select 'Alpha' and additional statistics such as 'Item-Total Statistics' and 'Scale if Item Deleted' for a comprehensive analysis.
🔍 Interpreting Cronbach's Alpha Results and Item Deletion
The video script explains how to interpret the results of Cronbach's Alpha analysis. Initially, the Alpha value is found to be 0.606, which is considered questionable as a reliability coefficient (0.7 is generally accepted as good). The means and standard deviations of the items are reviewed, noting that items 7 and 10 have higher means and standard deviations. The inter-item correlation matrix and item-total statistics are also examined. Notably, the 'Scale if Item Deleted' statistic shows that deleting any item except for item 10 would decrease the Alpha value. Removing item 10 increases the Alpha to 0.698, which is very close to the acceptable level. Further analysis shows that excluding item 7 increases the Alpha to 0.76, indicating a good reliability coefficient. The video concludes by emphasizing that while Cronbach's Alpha is a useful statistic, it has limitations. For instance, it assumes normal distribution of data and does not indicate the number of constructs being measured; factor analysis is required for that. The video ends with an invitation for viewers to contact Dr. Grande with any questions or concerns.
Mindmap
Keywords
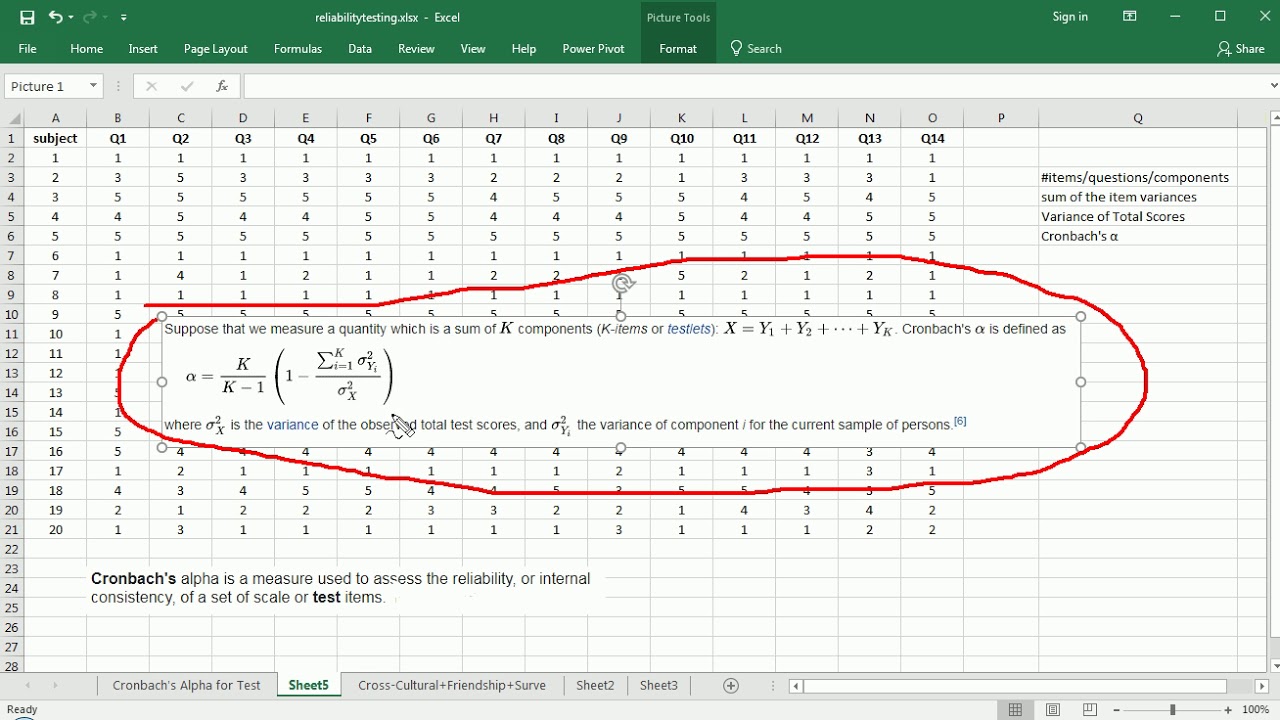
💡Cronbach's Alpha
💡Likert Scale
💡Reliability
💡Scale
💡Ordinal
💡SPSS
💡Item Total Statistics
💡Inter-Item Correlation Matrix
💡Normal Distribution
💡Factor Analysis
💡Internal Consistency
Highlights
Dr. Grande introduces a video on calculating Cronbach's Alpha, a measure of reliability for a scale.
The video uses a dataset in SPSS with 50 cases and 10 individual Likert scale items.
Cronbach's Alpha is popular for assessing reliability in Likert scales, which is why it's used in this example.
Likert scales are considered ordinal for the demonstration, though they can also be treated as scales in some contexts.
The video demonstrates how to perform a reliability analysis in SPSS, including selecting the correct items and statistics.
The initial Cronbach's Alpha value is found to be 0.606, which is considered questionable.
Item statistics reveal that removing Item 10 increases the Alpha to 0.698, nearing an acceptable level.
Further analysis shows that removing Item 7 increases Cronbach's Alpha to 0.76, indicating good reliability.
The final recommended items for the scale are Items 1 through 6, and 8 and 9, to achieve a good reliability coefficient.
Cronbach's Alpha is a useful statistic for calculating reliability, but it has limitations and cautions.
Higher Cronbach's Alpha values are obtained when data is normally distributed rather than skewed.
A high Cronbach's Alpha does not necessarily indicate the number of underlying constructs; factor analysis is needed for that.
The video provides a step-by-step guide on how to interpret and use Cronbach's Alpha results.
The importance of considering the impact of removing individual items on the overall scale reliability is emphasized.
The video concludes with an invitation for viewers to contact Dr. Grande with any questions or concerns.
Cronbach's Alpha is demonstrated to be a valuable tool for assessing and improving the reliability of a measurement instrument.
The video offers practical applications of Cronbach's Alpha in the context of scale development and refinement.
The process of determining which items to retain or delete to enhance reliability is clearly explained.
Transcripts
Browse More Related Video


5.0 / 5 (0 votes)
Thanks for rating: