How to Graph Piecewise Functions (Precalculus - College Algebra 12)
TLDRThe video script provides an in-depth exploration of piecewise functions, a type of mathematical function that changes its formula based on the interval of the input value. The instructor emphasizes the importance of understanding the domain of each piece of the function, which dictates when each part is used. The script walks through the process of evaluating piecewise functions by determining where an input value fits within the defined domains and then applying the corresponding formula. It also covers how to graph these functions, highlighting the need to avoid crossing or overlapping graphs on the same x-axis interval, which would violate the principle of a function that assigns a single output to each input. The concept of continuity in functions is briefly touched upon, with the piecewise nature often leading to discontinuities. The script is educational and aims to equip viewers with the practical skills to work with piecewise functions, including their evaluation and graphical representation.
Takeaways
- 📈 Understanding Piecewise Functions: A piecewise function is a function defined by multiple pieces, each valid for a specific interval of the domain.
- 📊 Graphing Techniques: To graph a piecewise function, identify the domain for each piece and ensure the graph does not cross or overlap on the x-axis.
- 🔍 Evaluating at Boundaries: When evaluating a piecewise function, determine which piece of the function to use based on the input's interval.
- 🚫 Avoiding Multiple Outputs: For any given input, a piecewise function should yield only one output to maintain its function properties.
- ✅ Using Open and Closed Circles: Use open circles to denote points not included in the domain and closed circles for points that are included.
- 🔑 Domain as a Guide: The domain is crucial as it dictates which part of the function to use for a given x-value.
- 📐 Key Features of Graphs: Key features like slope, parabolic shape, and the behavior of cubic functions are essential for graphing piecewise functions.
- 🔄 Transformations of Functions: Knowledge of function transformations (like stretching and compressing) is important for graphing piecewise functions.
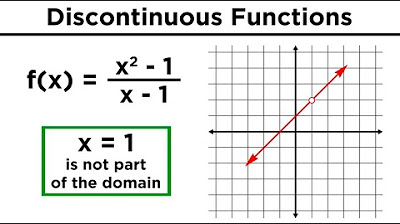
- ➗ Discontinuities in Graphs: Be aware of discontinuities in piecewise functions, where the graph may have jumps or gaps.
- 🔶 Continuity Check: A continuous function can be drawn without lifting the pen from the paper; piecewise functions often are not continuous.
- 📚 Library of Functions: Building a library of basic function shapes (like quadratics and cubics) helps in understanding and graphing piecewise functions.
Q & A
What is a piecewise function?
-A piecewise function is a function defined by multiple pieces, each of which is defined over a specific interval of the domain. It means that for every input, there is exactly one output, but the function is composed of different expressions that apply to different parts of the input domain.
How do you determine which piece of a piecewise function to use for a given input?
-You determine which piece to use by looking at the domain of the function and identifying the interval to which the input belongs. The corresponding piece that covers that interval is then used to calculate the output.
What is the significance of the domain in piecewise functions?
-The domain in piecewise functions is crucial as it specifies the intervals for which each piece of the function is defined. It guides the evaluation process by indicating which part of the function to use for a given input value.
How does the graph of a piecewise function relate to its domain?
-The graph of a piecewise function is a visual representation of its domain. It separates the x-axis into intervals, and each interval corresponds to a different piece of the function. The graph ensures that there is no overlap and that each input value is associated with a single output value.
What is a key consideration when graphing a piecewise function to maintain its property as a function?
-A key consideration is ensuring that the graph does not have any crossings or overlaps on the same interval of the x-axis. This is because a function must have exactly one output for each input, and crossing or overlapping would imply multiple outputs for the same input, violating the definition of a function.
What is the role of the boundary values in graphing piecewise functions?
-Boundary values, also known as separating values, are used to determine the intervals on the x-axis where different pieces of the function apply. When graphing, these values help to identify where to start and stop each piece of the function, ensuring that the graph accurately reflects the domain of the function.
How do you handle points on the graph where the input value falls exactly on a boundary value?
-If the input value falls exactly on a boundary value, you must check whether the domain includes that value (indicated by an equals sign). If it does, you use a solid circle at that point; if not, you use an open circle to indicate that the point is not included in the graph of that particular piece of the function.
What is the concept of continuity in the context of piecewise functions?
-Continuity in piecewise functions refers to the property where the graph can be drawn without lifting the pencil from the paper within a given interval. If the graph has jumps or breaks, the function is discontinuous at those points. A continuous piecewise function ensures there are no such jumps within its defined intervals.
How can you tell if a piecewise function is continuous or discontinuous by looking at its graph?
-You can tell if a piecewise function is continuous by ensuring that the graph has no breaks or jumps within the intervals defined by the domain. If you can draw the entire graph without lifting the pencil, it is continuous. Discontinuities are indicated by open circles at boundary points or by the graph lines crossing each other.
What is the importance of understanding the basic graph shapes when working with piecewise functions?
-Understanding basic graph shapes like lines, parabolas, and cubics is important because they form the building blocks of piecewise functions. Knowing these shapes helps in visualizing and drawing the graph of a piecewise function accurately, as well as in evaluating the function for specific input values.
What are the steps to graph a piecewise function?
-The steps to graph a piecewise function are: (1) Identify the domain and the intervals for each piece of the function. (2) Determine the boundary values or separating numbers. (3) For each interval, graph the corresponding piece of the function. (4) Use open circles for boundary points that are not included in the domain. (5) Ensure there are no overlaps or crossings in the graph to maintain the function's definition.
Outlines
📚 Introduction to Graphing and Piecewise Functions
The video begins with an introduction to graphing, emphasizing the importance of understanding graphing techniques. The focus is on piecewise functions, their definition, and how they work. The video aims to provide clarity on the concept of piecewise functions, their domains, and how to graph them. It also mentions the intention to review basic graph shapes and functions to build a strong foundation for understanding more complex concepts like polynomials and rational functions.
📈 Understanding Piecewise Functions and Their Domains
This paragraph delves deeper into the specifics of piecewise functions, explaining how they are defined and how to determine their domains. It clarifies that each piece of a piecewise function is associated with a specific interval on the x-axis and that inputs must be evaluated within their corresponding domains. The paragraph also discusses the importance of ensuring that each input has a unique output, as required for a function, and provides examples of how to evaluate piecewise functions for different inputs.
📊 Graphing Techniques for Piecewise Functions
The paragraph outlines the process of graphing piecewise functions, starting with an explanation of how the domain divides the x-axis into intervals. It emphasizes the importance of using the domain to determine which piece of the function to use for graphing. The paragraph also discusses the concept of continuity in functions and how to handle points where the function is not defined, using open circles to represent missing values at the boundaries.
🔢 Evaluating Piecewise Functions and Graphing Quadratics
This section focuses on evaluating piecewise functions for specific values and graphing quadratic functions. It explains how to identify the appropriate piece of the function to use based on the domain and how to graph quadratic functions within their defined intervals. The paragraph also addresses the concept of even functions and their symmetry about the y-axis, and how to handle the y-intercept when graphing.
📈 Graphing Linear Functions and Understanding Discontinuities
The paragraph discusses the process of graphing linear functions within the context of piecewise functions. It explains how to find the y-intercept and use the slope to graph the line. The section also addresses discontinuities in piecewise functions, explaining how to handle cases where the function is not continuous and how to represent these discontinuities graphically with open circles at the boundary points.
📊 Combining Intervals and Graphing Multiple Pieces
This part of the video script describes how to graph piecewise functions that consist of multiple pieces, each defined on different intervals of the x-axis. It explains the process of identifying the domain for each piece and graphing them separately, ensuring that the graph reflects the correct intervals and boundaries. The paragraph also touches on the concept of continuity and how to handle missing points at the boundaries of the defined intervals.
🎓 Summary and Future Topics
The video concludes with a brief summary of the key points covered in the lesson and a preview of upcoming topics. It emphasizes the importance of understanding piecewise functions, their domains, and graphing techniques. The viewer is encouraged to practice these concepts and anticipates future lessons that will explore additional functions and graphing techniques.
Mindmap
Keywords
💡Piecewise Function
💡Domain
💡Graphing
💡Slope
💡Parabolas
💡Cubic Functions
💡Continuity
💡Linear Functions
💡Quadratic Functions
💡Boundary Values
💡Graph Shapes
Highlights
The video introduces the concept of piecewise functions, explaining how they are defined and used in graphing.
Piecewise functions are composed of multiple segments, each with its own rule for the function's behavior.
The domain of a piecewise function dictates which segment or 'piece' is used for a given input value.
The importance of having a single output for each input is emphasized, maintaining the function's definition.
The video demonstrates how to evaluate piecewise functions by determining the appropriate piece for the given input's domain.
Graphical representation of piecewise functions is explored, showing how they should not cross or overlap on the graph.
The process of graphing piecewise functions involves separating the x-axis into intervals and graphing each piece within its interval.
Key features of basic graph shapes such as parabolas, cubics, and lines are reviewed to understand their roles in piecewise functions.
The concept of continuity in functions is discussed, noting that piecewise functions may be discontinuous due to their segmented nature.
The video illustrates how to handle points where the function is not defined by using open circles at the endpoints.
A step-by-step guide on graphing piecewise functions is provided, emphasizing the need to respect the boundaries set by the domain.
The difference between including an endpoint (using a closed circle) and excluding it (using an open circle) is clarified.
The video provides practical examples of graphing piecewise functions, highlighting the need to understand the function's behavior within each interval.
The importance of recognizing when a piecewise function results in a continuous or discontinuous graph is discussed.
The process of evaluating piecewise functions for specific x-values and determining the corresponding y-values is demonstrated.
The video concludes with a reminder to practice graphing piecewise functions to solidify the understanding of their behavior and graphing techniques.
Transcripts


5.0 / 5 (0 votes)
Thanks for rating: