Business Calculus - Math 1329 - Section 1.1 - Functions
TLDRThe video script delves into the concept of functions within a mathematical context, focusing on evaluating functions represented by various forms such as equations, tables, and graphs. It emphasizes the importance of understanding the domain of a function, which is the set of all permissible input values, and how it can be influenced by real-world applications and constraints. The script also introduces piecewise functions, which are necessary when a single expression cannot represent the function across its entire domain. Additionally, the transcript explores business functions, including demand, supply, revenue, cost, and profit, highlighting their significance in economic scenarios. The video uses examples to illustrate how to calculate and interpret these functions, providing a clear understanding of their practical applications in business and economics.
Takeaways
- 📚 A function is a rule that assigns one and only one output (value) for each input (variable, usually denoted as X).
- 📈 The notation f(X) represents a function named 'f' with 'X' as the input variable.
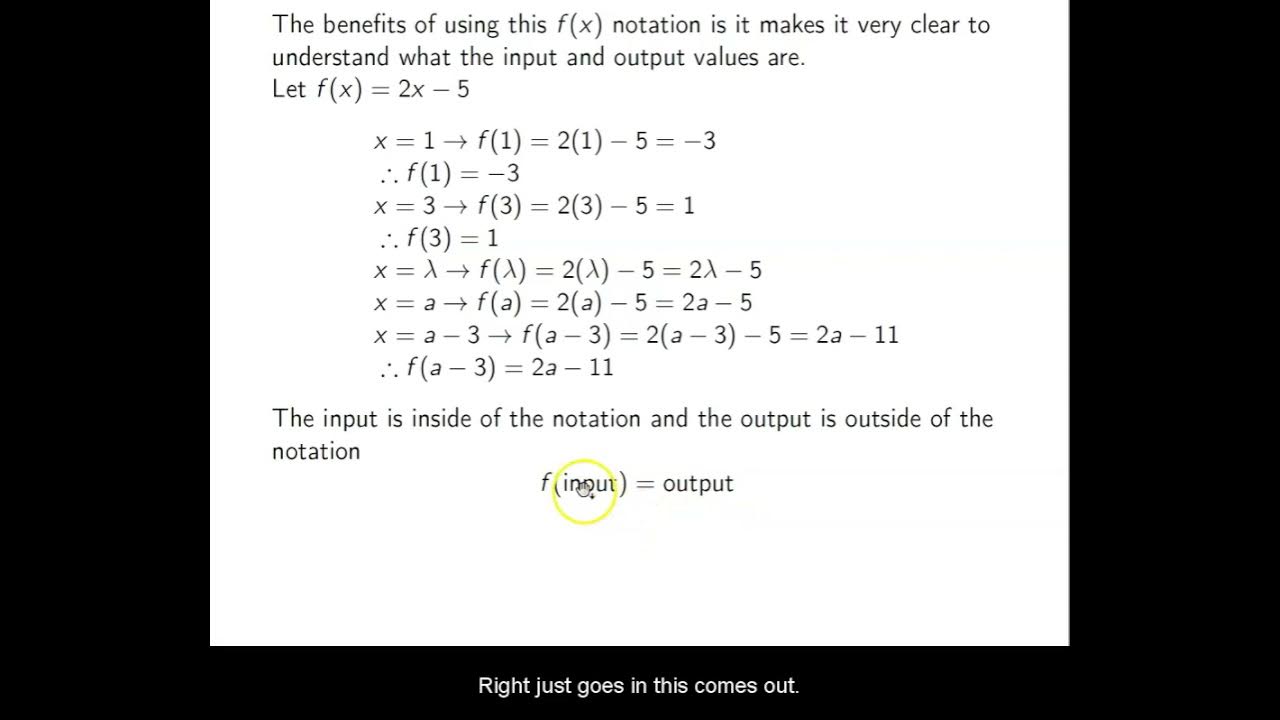
- 🧮 To evaluate a function at a specific point, substitute the input value into the function's formula and perform the calculation.
- 📊 When graphing a function, ensure axes are labeled, include tick marks, and represent the data points accurately.
- 🚫 The domain of a function is the set of all possible input values (X) that make sense in the context of the function and its applications.
- 🛑 For functions involving square roots, the value inside the root must be non-negative, especially when it's in the denominator.
- 🔢 The interval notation is used to represent the domain of a function, showing the range of valid input values.
- 🧩 Piecewise functions use different expressions for different intervals of the domain to represent complex relationships.
- 📈📉 Business functions such as price demand, price supply, revenue, cost, and profit are essential in economic modeling.
- 💰 Revenue (R) is calculated as the number of items sold (X) multiplied by the price per item (P(X)).
- 📊 The profit function (P) is determined by subtracting the cost function (C) from the revenue function (R).
- ✅ To find the average cost per item, divide the total cost by the number of items produced.
Q & A
What is the main focus of section 1.1 in the transcript?
-The main focus of section 1.1 is to evaluate various representations of functions, including those given by equations, tables of values, and graphs. It also covers finding the domain of a function, using piecewise functions, and reviewing business functions related to the course.
How is the notation for functions typically represented?
-The notation for functions is typically represented as f(X), where 'f' is the function name and 'X' is the input variable.
What does the term 'domain' refer to in the context of functions?
-The domain refers to the set of all possible input values (X values) for which a function is defined.
How is the value of a function at a specific input determined?
-The value of a function at a specific input is determined by substituting the input value into the function's equation and performing the necessary calculations.
What is a piecewise function and why is it used?
-A piecewise function is a function that is defined by multiple sub-functions, each applicable to a different interval of the function's domain. It is used when a single expression cannot accurately represent the function across its entire domain.
What are the different types of business functions mentioned in the transcript?
-The different types of business functions mentioned are price demand, price supply, revenue, cost, and profit functions.
How is the revenue function typically defined in terms of the price function and the quantity sold?
-The revenue function is typically defined as the product of the price function (P(X)) and the quantity sold (X), which is represented as R(X) = X * P(X).
What is the formula for calculating profit in terms of revenue and cost?
-The formula for calculating profit is given by Profit = Revenue - Cost, which can be represented as P(X) = R(X) - C(X), where P(X) is the profit function, R(X) is the revenue function, and C(X) is the cost function.
How does the average cost per item vary with the production level?
-The average cost per item varies with the production level because fixed costs are spread over a larger number of items as production increases, thus reducing the average cost per item.
What is the significance of understanding the revenue function in the context of business applications?
-Understanding the revenue function is significant in business applications because it helps in determining the total income generated from selling a certain quantity of goods or services, which is crucial for financial planning and decision-making.
How does the price of an item typically relate to the quantity demanded and supplied according to economic principles?
-According to economic principles, as the quantity demanded of an item increases, the price per item typically goes down (demand curve). Conversely, as the quantity supplied increases, the price per item typically goes up (supply curve).
Outlines
📈 Introduction to Functions and Their Evaluation
This paragraph introduces the concept of functions, their evaluation through different representations like equations, tables, and graphs. It emphasizes the importance of understanding the domain of a function and how piecewise functions work. The paragraph also mentions business functions related to price, demand, supply, revenue, cost, and profit.
🧮 Evaluating Functions and Interpreting Data
The paragraph explains how to evaluate functions by substituting values and the significance of notation in mathematics. It uses the example of the population of Texas since 1950 to illustrate how to work with tables of values and interpret the results in a real-world context.
📊 Graphing Functions and Understanding Domain Restrictions
This section discusses the importance of graphing functions with properly labeled axes and tick marks. It also explains the concept of the domain of a function, including restrictions due to denominators, even roots, and real-world applications where certain values don't make sense.
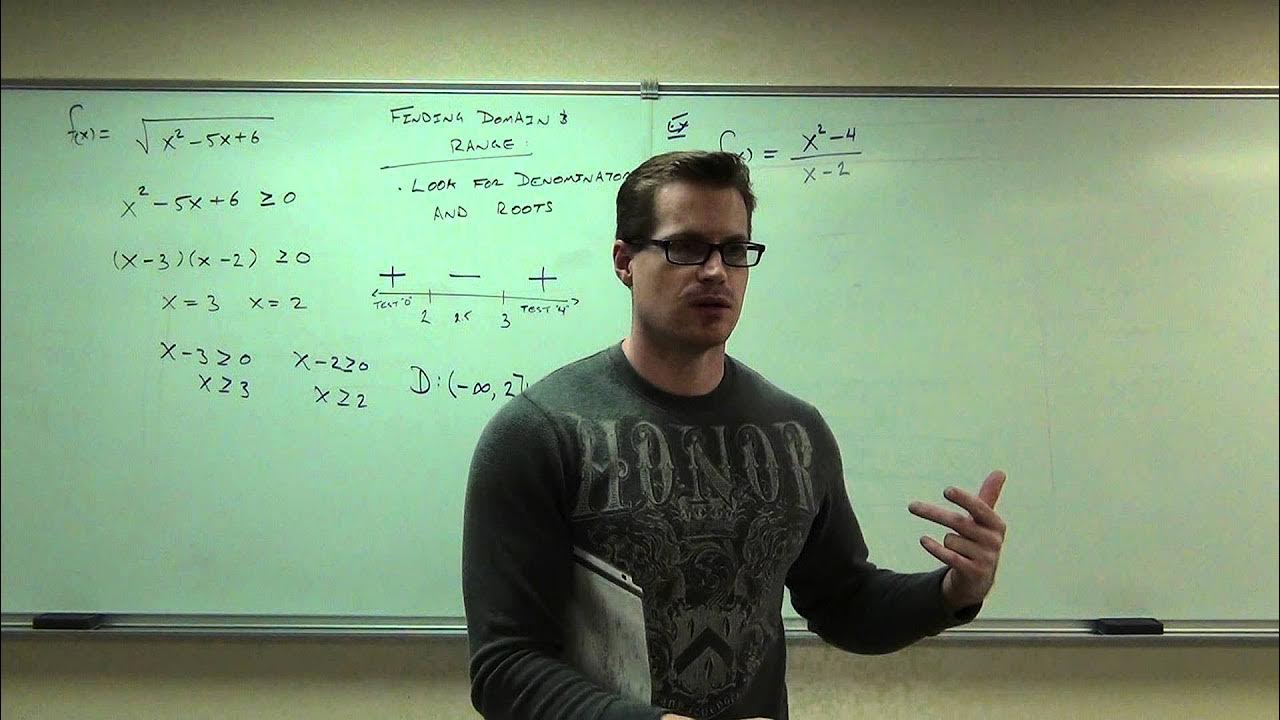
✅ Finding the Domain of Various Functions
The paragraph provides examples of how to find the domain of different functions, including those with no restrictions, those with denominators that cannot be zero, and those involving even roots where the value inside cannot be negative.
🔢 Domain of Functions with Mixed Conditions
This part explores finding the domain of functions with mixed conditions, such as fractions and even roots in the denominator. It uses interval notation to represent the domain and provides a trick for excluding values that would make the denominator zero.
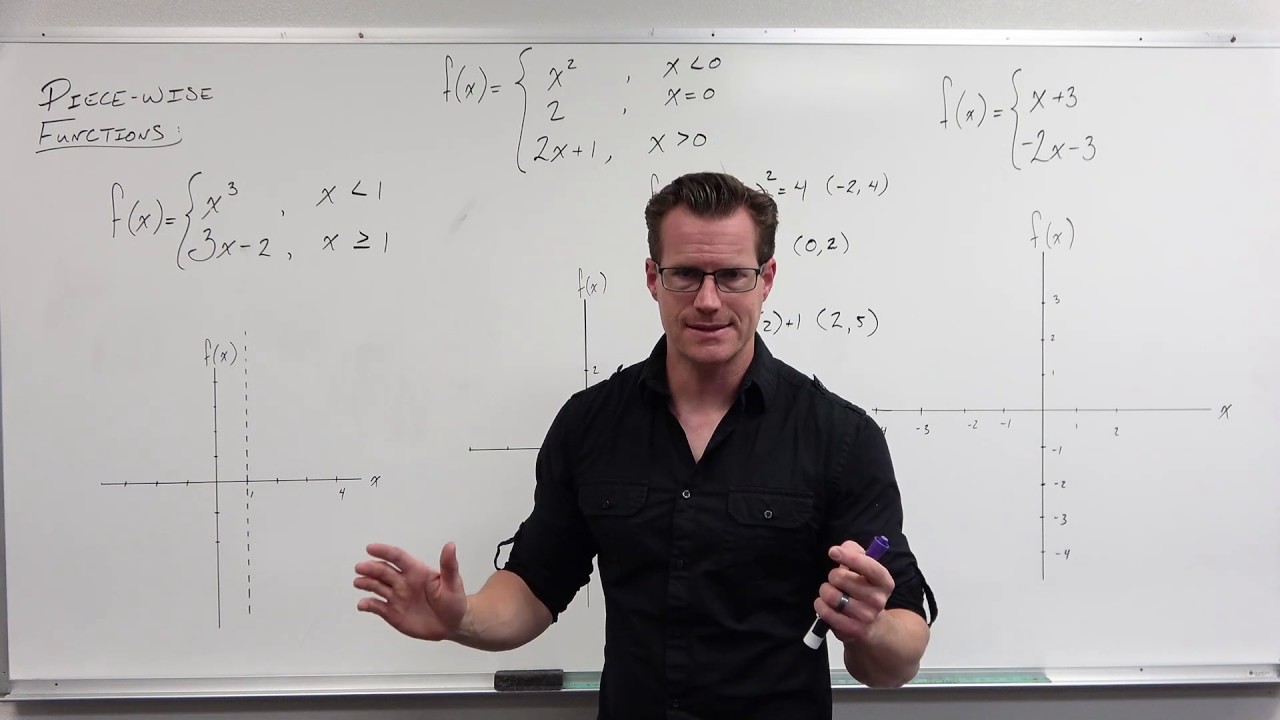
🧩 Piecewise Functions and Their Evaluation
The paragraph explains piecewise functions, which are used when a single expression cannot represent a function accurately. It provides an example of a piecewise function and demonstrates how to evaluate it based on the given domain for each expression.
📉 Business Functions and Their Economic Principles
This section reviews business functions, including demand, supply, revenue, cost, and profit functions. It explains the economic principles behind these functions, such as how the price per item can change with the quantity demanded or supplied, and introduces the concept of average functions.
🍫 Economic Functions Applied to X-Ray Bars
The paragraph applies the concepts of economic functions to a specific example, the pricing and production of X-Ray bars. It shows how to calculate revenue, profit, and average cost at different production levels, emphasizing the importance of understanding these functions in a business context.
📊 Calculating Specific Economic Metrics for X-Ray Bars
This part focuses on calculating the cost of producing the 100th and 101st X-Ray bars, highlighting the difference between total cost and the cost of an individual item at a specific production level. It reinforces the concept that average costs can decrease with higher production volumes due to fixed costs.
Mindmap
Keywords
💡Function
💡Domain
💡Piecewise Function
💡Graphing Functions
💡Business Functions
💡Revenue Function
💡Cost Function
💡Profit Function
💡Average Cost
💡Marginal Cost
Highlights
The section covers the evaluation of functions using various representations, including equations, tables, and graphs.
Functions are defined as a rule assigning one output for each input, often denoted as f(X).
The importance of notation and the correct use of equal signs in mathematical expressions is emphasized.
The concept of domain in functions is introduced, which is the set of all possible input values.
Piecewise functions are discussed, which use multiple expressions to represent different parts of the domain.
Business functions such as price, demand, supply, revenue, cost, and profit are reviewed in the context of their mathematical representation.
The revenue function R(X) is defined as the product of the number of items sold (X) and the price per item (P(X)).
The cost function C(X) represents the total cost of producing X items, a key factor in determining profit.
Profit is calculated as the difference between revenue and cost, with the formula P(X) = R(X) - C(X).
Average functions are introduced for revenue, cost, and profit, providing insight into per-unit metrics.
The transcript provides a detailed example of calculating the revenue, cost, and profit for producing a certain number of X-ray bars.
The concept of average cost per unit is explained, noting that it varies based on the production level due to fixed costs.
The method for finding the cost of a single unit, such as the 101st unit, is demonstrated by subtracting the total cost of producing 100 units from that of 101 units.
The importance of understanding the economic principles behind supply, demand, and pricing models is highlighted for business applications.
The transcript emphasizes the practical application of function notation and domain considerations in real-world scenarios.
Graphical representation of functions, including how to plot points and create curves, is explained to visualize data and understand function behavior.
The role of piecewise functions in accurately representing complex real-world phenomena that cannot be described by a single expression is discussed.
The transcript offers a comprehensive guide on how to interpret and apply business functions, which are crucial for economic analysis and decision-making.
Transcripts
Browse More Related Video
Business Calculus - Math 1329 - Section 2.5 - Marginal Analysis and Differentials
Business Calculus - Math 1329 - Section 7.1 - Functions of Several Variables

Math 1325 Lecture 9 9 - Applications
Calculus 1 Lecture 0.2: Introduction to Functions.
How to Graph Piecewise Functions (Precalculus - College Algebra 12)
Ch. 2.1 Functions
5.0 / 5 (0 votes)
Thanks for rating: