4 Course Meta-Analyses VU: Calculating and pooling effect sizes
TLDRThis script offers a comprehensive guide to conducting a meta-analysis, focusing on calculating effect sizes for both continuous and dichotomous outcomes. It introduces software tools like Comprehensive Meta-Analysis and explains how to interpret forest plots and pooled effect sizes. The speaker emphasizes the importance of choosing between fixed and random effects models, advocating for the latter in psychological treatments due to inherent study differences. The tutorial also covers transforming effect sizes into numbers needed to treat for better clinical comprehension.
Takeaways
- 📚 Conducting a meta-analysis involves calculating and pooling effect sizes from different studies to synthesize findings.
- 🧐 Effect size calculation depends on the type of outcome being measured, such as continuous (e.g., levels of depression, anxiety) or dichotomous (e.g., yes/no outcomes).
- 📈 To calculate effect sizes for continuous outcomes, you need the mean, standard deviation, and number of participants from both the treatment and control groups.
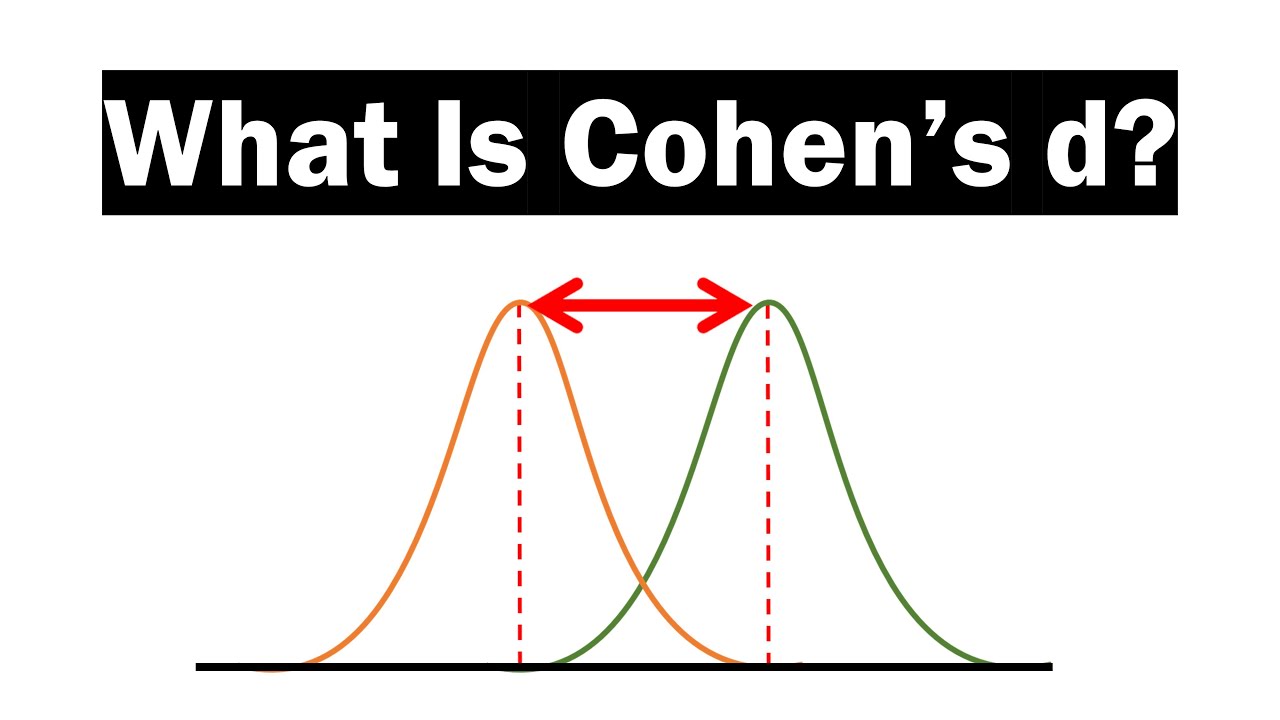
- 📊 Cohen's D is a common measure of effect size, calculated as the difference between group means divided by a pooled standard deviation.
- 🔍 When standard deviations are not reported, other statistics like confidence intervals or standard errors can be used to estimate them.
- 📉 Effect sizes can be difficult to interpret for patients or therapists, so transforming them into 'numbers needed to treat' can make them more comprehensible.
- 📝 Data for meta-analysis is often collected in an Excel file, detailing means, standard deviations, and participant numbers for each group.
- 🔬 Pooling effect sizes combines the results from individual studies into one overall estimate, which can be more precise and reveal smaller effects.
- 🤔 The choice between fixed and random effects models for pooling depends on the assumption about the homogeneity of the studies; random effects model is generally preferred for complex interventions.
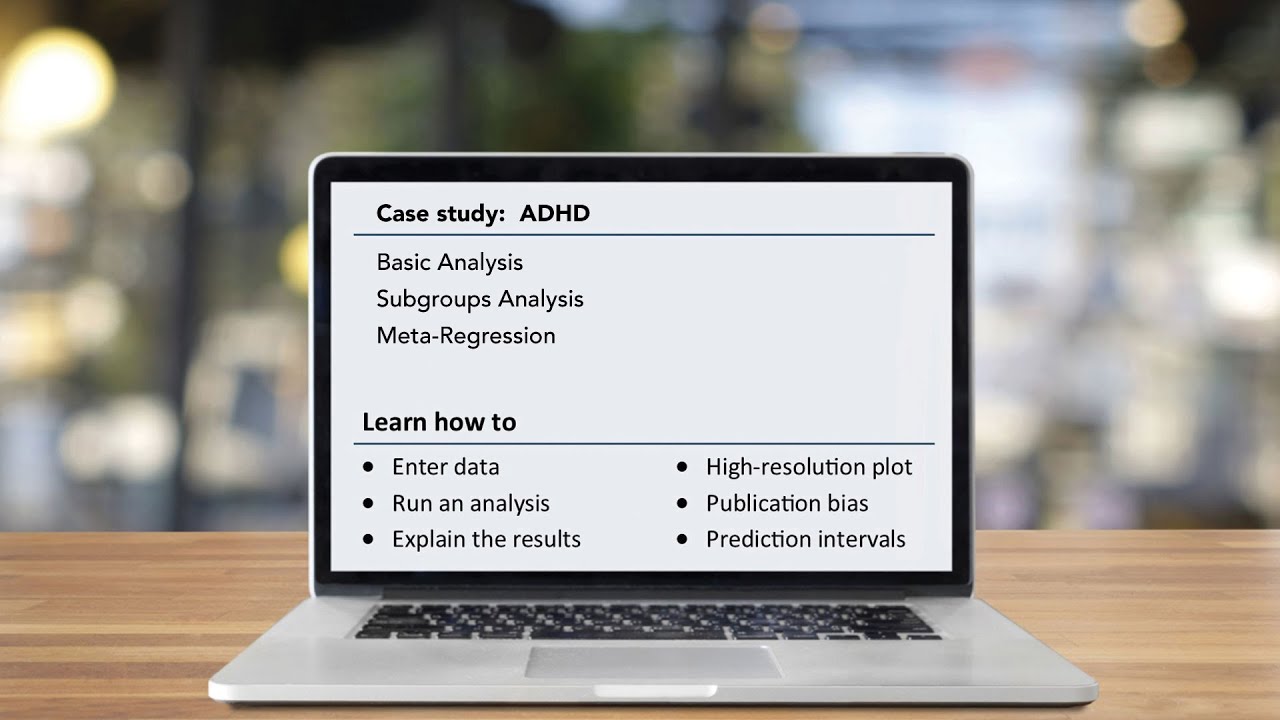
- 🛠️ Software like Comprehensive Meta-Analysis (CMA) can be used for conducting meta-analysis, allowing for easy data entry and analysis.
- 🌲 Forest plots are a key tool in meta-analysis, providing a visual summary of individual study effects, confidence intervals, and the pooled effect size.
Q & A
What is the purpose of calculating effect sizes in meta-analysis?
-Effect sizes are calculated in meta-analysis to quantify the magnitude of the effect of a treatment or intervention across different studies, allowing for a standardized measure of impact that can be compared and combined across various research outcomes.
What types of outcomes can be used for calculating effect sizes in meta-analysis?
-Effect sizes can be calculated based on continuous outcomes, such as levels of depression, anxiety, or quality of life, as well as dichotomous outcomes, which are yes/no or presence/absence of a condition.
Why is it necessary to use the mean and standard deviation from treatment and control groups to calculate effect sizes for continuous outcomes?
-The mean and standard deviation are necessary to understand the distribution and dispersion of the data in each group. They allow for the calculation of Cohen's D, which is a standardized measure of the difference between the treatment and control groups in terms of standard deviations.
What is Cohen's D and how is it calculated?
-Cohen's D is a measure of effect size that indicates the difference between the means of two groups (e.g., treatment and control) divided by a pooled standard deviation of the two groups. It helps to quantify the magnitude of the effect in terms of standard deviations.
Why might one choose to use Hedges' g instead of Cohen's D?
-Hedges' g is used instead of Cohen's D when there is a concern about small sample bias. It adjusts for the fact that Cohen's D can overestimate the effect size in studies with small sample sizes.
What is the forest plot and how does it summarize a meta-analysis?
-A forest plot is a graphical representation used in meta-analysis that displays the effect sizes and confidence intervals of individual studies, as well as the pooled effect size. It provides a visual summary of the results, allowing for easy comparison and identification of outliers.
What are the two basic methods of pooling effect sizes in meta-analysis?
-The two basic methods of pooling effect sizes are the fixed effects model and the random effects model. The fixed effects model assumes that all studies are estimating the same effect size, while the random effects model allows for variability between studies.
Why is the random effects model preferred for meta-analyses of psychological treatments?
-The random effects model is preferred for psychological treatments because it accounts for the heterogeneity between studies, acknowledging that there are likely differences in effect sizes due to various factors such as population, intervention specifics, and study design.
What software is recommended for conducting meta-analysis according to the transcript?
-The transcript recommends 'Comprehensive Meta-Analysis' as the best software package for conducting meta-analysis at the moment due to its ease of use and the availability of sophisticated analysis options.
How can the concept of 'numbers needed to be treated' (NNT) help in interpreting effect sizes for patients or therapists?
-The 'numbers needed to be treated' (NNT) is a way to translate effect sizes into a more clinically meaningful measure. It indicates how many patients need to be treated with a particular intervention to achieve one additional positive outcome compared to a control condition, making it easier for patients and therapists to understand the benefits of a treatment.
Outlines
📚 Calculating and Interpreting Effect Sizes in Meta-Analysis
This paragraph introduces the process of conducting a meta-analysis, specifically focusing on calculating effect sizes. It explains that the method of calculation depends on the type of outcome being studied, such as continuous outcomes like levels of depression or anxiety. The speaker discusses how to calculate Cohen's D using mean, standard deviation, and the number of participants from both the treatment and control groups. The paragraph also touches on the challenges of interpreting effect sizes for patients and therapists and suggests transforming them into 'numbers needed to be treated' for better comprehension. Additionally, it hints at the use of software for meta-analysis and the importance of understanding how to extract relevant data from studies.
📈 Understanding and Extracting Data for Effect Size Calculation
The second paragraph delves into the specifics of extracting data from research papers to calculate effect sizes. It describes how to focus on relevant tables within a study's PDF that contain the necessary information such as mean, standard deviation, and sample size for both the intervention and control groups. The speaker also addresses the challenge of interpreting effect sizes and introduces the concept of 'numbers needed to be treated' as a more comprehensible measure. Furthermore, the paragraph discusses alternative methods of calculating effect sizes based on dichotomous outcomes using odds ratios or relative risks and emphasizes the importance of collecting the right data for meta-analysis calculations.
🔍 Pooling Effect Sizes and Choosing the Right Model for Meta-Analysis
This paragraph discusses the concept of pooling effect sizes in meta-analysis, which involves combining the results from individual studies to create an overall estimate of the true effect size. It highlights the advantages of pooling, such as increased precision and the ability to detect smaller effects. The speaker explains two methods of pooling: the fixed effects model, which assumes all studies are exact replications, and the random effects model, which allows for heterogeneity between studies. The paragraph advocates for the use of the random effects model in psychological treatments due to the inherent differences between studies and provides guidance on choosing between the two models.
🛠️ Software Tools for Conducting Meta-Analysis
The fourth paragraph provides an overview of software tools available for conducting meta-analysis. It mentions several statistical packages like Stata, SPSS, and SAS, as well as specific macros and the Cochrane Collaboration's Review Manager. The speaker strongly recommends 'Comprehensive Meta-Analysis' as the most user-friendly and comprehensive software package available, which allows for easy data entry and analysis. The paragraph also provides a brief tutorial on how to use the software, from entering data to running basic and advanced analyses.
📊 Navigating Comprehensive Meta-Analysis Software and Interpreting Results
This paragraph offers a step-by-step guide on how to use the Comprehensive Meta-Analysis (CMA) software. It explains the process of entering study names, outcome names, and effect size data into the software. The speaker demonstrates how to calculate effect sizes using mean, standard deviation, and sample size, and how to indicate the direction of the effect size. The paragraph also discusses how to run a basic analysis using the software and interpret the results, including understanding the summary output and examining potential outliers using a forest plot.
🌲 Interpreting Forest Plots and Effect Sizes in Meta-Analysis
The final paragraph focuses on interpreting forest plots and effect sizes within the context of a meta-analysis. It describes the forest plot as an excellent summary that provides an overview of individual study effects, their confidence intervals, and the pooled outcome. The speaker uses an example from a published meta-analysis to illustrate how to identify and examine outliers. The paragraph also discusses the importance of understanding that effect sizes are statistical measures and may not always correlate with clinical relevance, emphasizing the need to consider the context when interpreting these results.
Mindmap
Keywords
💡Meta-analysis
💡Effect size
💡Cohen's D
💡Pooled standard deviation
💡Continuous outcomes
💡Dichotomous outcomes
💡Forest plot
💡Random effects model
💡Fixed effects model
💡Numbers needed to treat (NNT)
Highlights
The next step in conducting a meta-analysis is calculating and pulling effect sizes.
Effect sizes can be calculated based on continuous outcomes like levels of depression or anxiety, requiring mean, standard deviation, and number of participants from each group.
Cohen's D is a common measure for effect sizes, calculated as the difference between two group means divided by the pooled standard deviation.
Hedges' g is an alternative to Cohen's D, adjusting for small sample sizes.
When standard deviations are not reported, other statistics like confidence intervals or standard errors can be used to calculate them.
Exact p-values, T-values, or F-values can also be used to calculate effect sizes when they indicate the difference between two groups.
For calculating effect sizes from baseline to post-test within one group, the correlation between pretest and post-test scores is needed, which is often not reported.
An Excel file can be used to organize data from various studies for calculating effect sizes.
Effect sizes can be challenging to interpret for patients or therapists, so transforming them into numbers needed to treat can make them more comprehensible.
The random effects model is preferred for pooling effect sizes in meta-analysis, especially for complex interventions like psychological treatments.
Subgroup analysis or moderator analysis can be conducted to examine different groups of studies after pooling effect sizes.
Comprehensive Meta-Analysis software is recommended for its ease of use and comprehensive analysis options.
The forest plot is a summary of a meta-analysis, showing individual study effects, effect sizes, and the pooled outcome.
Outliers in a forest plot can be identified by comparing their confidence intervals with the pooled effect size.
Effect sizes are statistical measures and do not directly correlate with clinical relevance.
Cohen's D, while a useful measure, provides a rough estimate of small, moderate, and large effects, which can vary in clinical significance.
Software packages like Stata, SPSS, SAS, and Review Manager can be used for meta-analysis, but Comprehensive Meta-Analysis is highlighted for its user-friendly interface and advanced features.
Publication bias can be examined using funnel plots within meta-analysis software.
Transcripts


5.0 / 5 (0 votes)
Thanks for rating: