Meta-Analysis with CMA - Case Study: ADHD Treatment
TLDRThis workshop video script offers an in-depth guide on conducting meta-analysis, focusing on standardized mean differences. It covers data entry, analysis execution, effect size estimation, heterogeneity understanding, results reporting, and plotting. Advanced topics include subgroup analysis, meta regression, and publication bias assessment. The Comprehensive Meta-Analysis (CMA) software is utilized with a dataset examining methylphenidate's impact on cognitive function in adults with ADHD. The script serves as a valuable resource for researchers aiming to enhance their meta-analysis skills.
Takeaways
- 📚 The video is a workshop on meta-analysis, focusing on standardized mean differences and mean differences, and is part of a series.
- 📈 It covers basic and advanced topics including data entry, analysis execution, effect size estimation, heterogeneity understanding, reporting, and plotting.
- 🧐 The presenter uses Comprehensive Meta-Analysis (CMA) software to demonstrate the process, which is also available for download on metaanalysis.com.
- 📝 The example analysis involves 17 studies examining the impact of methylphenidate on cognitive function in adults with ADHD, based on data from a 2011 systematic review.
- 🗂️ Data is presented in Excel with columns for study names, treated and placebo group statistics, and potential moderating variables.
- 🔄 The video demonstrates how to copy data from Excel, paste it into CMA, and format it correctly for analysis, including identifying columns and their functions.
- 📊 The effect size index used is the standardized mean difference (d), and the video explains how to interpret and compute this within CMA.
- 🤔 The workshop discusses the importance of understanding heterogeneity and its impact on effect size variance across studies, correcting common misconceptions about interpreting heterogeneity statistics.
- 📉 The video addresses the issue of publication bias, demonstrating how to use CMA to perform a funnel plot analysis and sensitivity analysis.
- 📋 The presenter guides viewers on how to save and export results from CMA, create high-resolution plots, and modify plot aesthetics for reporting.
- 🔍 Advanced topics such as subgroup analysis and meta-regression are introduced to explore factors that might explain variation in effect sizes.
Q & A
What is the main focus of the workshop video?
-The workshop video focuses on conducting a meta-analysis, specifically covering data entry, analysis execution, effect size estimation, heterogeneity understanding, results reporting, and plotting, as well as advanced topics like subgroup analysis, meta-regression, and publication bias assessment.
Which software is used for the demonstration in the video?
-The software used for the demonstration is Comprehensive Meta-Analysis (CMA), which is used for conducting the meta-analysis discussed in the video.
What type of effect size index is primarily discussed in the video?
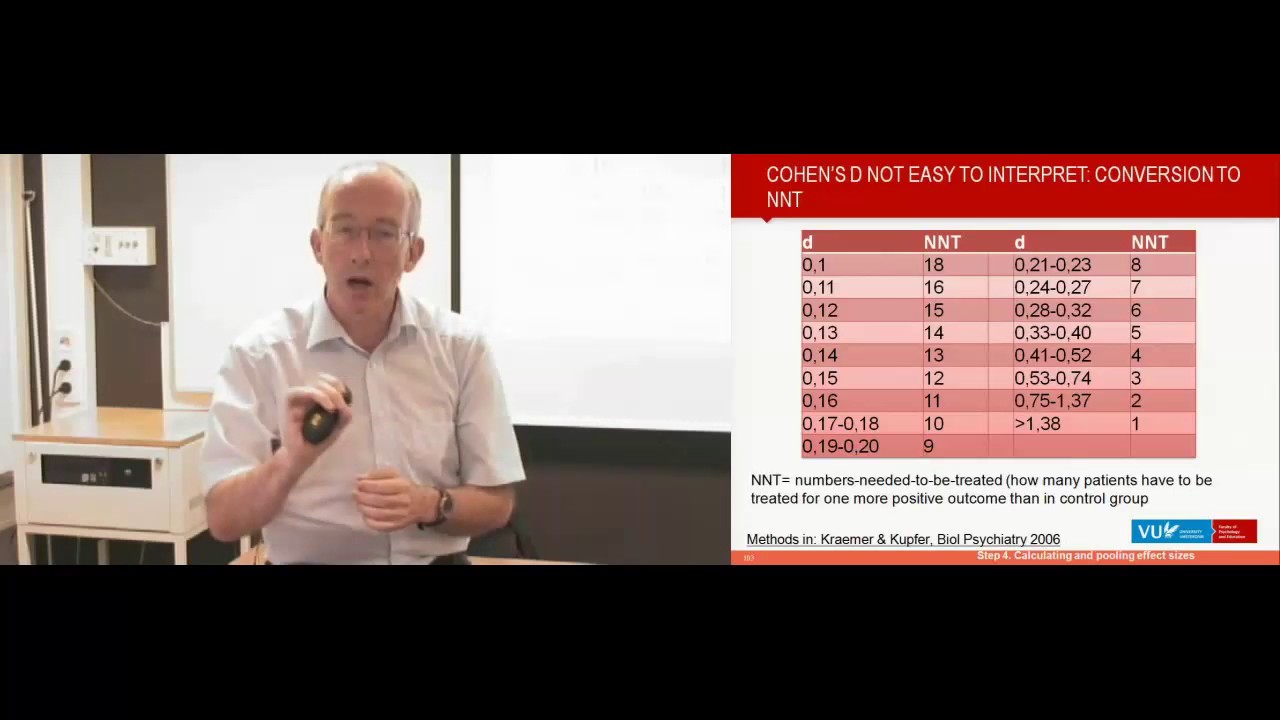
-The video primarily discusses the standardized mean difference (d), also known as Cohen's d, as the effect size index for the meta-analysis.
What are the key elements covered in the basic section of the workshop?
-The basic section covers how to enter data, run the analysis, estimate the mean effect size, understand heterogeneity and effects, report results, and create plots.
What is the purpose of using a random effects model over a fixed effect model in meta-analysis?
-The random effects model is used to account for variability between studies, assess dispersion of effect sizes across studies, and to generalize findings from the analyzed studies to a larger universe of comparable studies.
How does the video demonstrate the process of entering data into CMA?
-The video demonstrates data entry by showing the process of copying data from an Excel file, pasting it into CMA, identifying column functions, and assigning descriptive names to the groups.
What is the meaning of the standardized mean difference (Cohen's d) in the context of the video?
-In the context of the video, the standardized mean difference (Cohen's d) represents the effect size index used to measure the difference in means between treated and control groups in the studies, standardized to the scale of the outcome measure.
How does the video address the issue of heterogeneity in meta-analysis?
-The video addresses heterogeneity by explaining the use of statistics like Q value, I^2 statistic, and prediction intervals to assess the variability and dispersion of true effects across studies.
What is the purpose of the 'one study removed' sensitivity analysis shown in the video?
-The 'one study removed' sensitivity analysis is used to ensure that the results of the meta-analysis are robust and not overly influenced by any single study, by checking how the results change when each study is excluded one at a time.
How does the video discuss the assessment of publication bias?
-The video discusses the assessment of publication bias by demonstrating the use of a funnel plot and the trim and fill procedure to visually inspect for asymmetry and to impute potentially missing studies.
Outlines
📚 Introduction to Meta-Analysis Workshop
This paragraph introduces a workshop on meta-analysis, focusing on standardized mean differences. It's part of a series and is recommended for those planning to work with mean differences. The video covers basic and advanced topics such as data entry, analysis execution, effect size estimation, heterogeneity understanding, results reporting, and plot creation. It also addresses subgroup analysis, meta-regression, and publication bias assessment using the Comprehensive Meta-Analysis (CMA) software. The example is based on a study of methylphenidate's impact on cognitive function in adults with ADHD, using data from a 2011 review. The presenter guides viewers on using CMA with a free trial and dataset from their website, metaanalysis.com.
🔍 Data Entry and Column Identification in CMA
The speaker demonstrates how to enter data into CMA using an Excel file formatted for a tutorial. The data includes study names, means, standard deviations, sample sizes for treated and placebo groups, and potential moderating variables. The process involves copying data with labels, pasting it into CMA, and using the software's features to identify column functions, such as study names, effect size data, and sample characteristics. The goal is to prepare the data for meta-analysis within the software, ensuring correct identification of each column's role in the analysis.
📈 Customizing Data Display and Effect Size Computation
This section explains how to customize the display of data within CMA, focusing on the effect size computation. The speaker guides on identifying columns for treated and placebo group means, standard deviations, and sample sizes. It also discusses assigning descriptive names to groups and setting the effect direction, which is crucial for calculating the standardized mean difference (Cohen's d). The video shows how to automatically compute effect sizes and adjust the display to show standard errors and variance alongside the effect sizes.
📊 Running Analysis and Interpreting Results
The speaker details the process of running a meta-analysis in CMA, explaining the choice between fixed and random effects models. The random effects model is selected to account for study-to-study variance and to generalize findings to a broader universe of studies. The analysis results are presented, including the mean effect size, its confidence interval, and statistical tests for heterogeneity. The paragraph also clarifies misconceptions about interpreting heterogeneity statistics like I Square and the importance of understanding the prediction interval for effect size variation.
📉 Understanding Heterogeneity and Effect Size Dispersion
This part delves deeper into heterogeneity, explaining its relevance and how it's distinct from the confidence interval's precision. Heterogeneity is crucial for understanding the variability of true effect sizes across studies. The speaker refutes common misunderstandings about I Square and clarifies that it does not indicate the extent of effect size variation. Instead, the prediction interval is the statistic that provides insight into how much the effect size could vary in different populations.
📝 Saving and Annotating Analysis Results
The speaker discusses the importance of saving the analysis file in CMA and provides a step-by-step guide on annotating and exporting the results. Annotations can help clarify the interpretation of statistics like I Square and the prediction interval. The exported report can be used in other programs like Word or PowerPoint, facilitating the sharing and presentation of the meta-analysis findings.
🔧 Performing Sensitivity Analysis and Robustness Checks
Sensitivity analysis is introduced as a method to ensure the meta-analysis results' robustness. The speaker demonstrates how to assess the influence of individual studies on the overall effect size by examining the weight each study contributes to the analysis. Additionally, the 'one study removed' approach is used to test the stability of conclusions when excluding one study at a time. The robustness of the findings against potential publication bias is also discussed.
📉 Assessing Publication Bias Through Funnel Plots
The paragraph explains the concept of publication bias and its detection using funnel plots in CMA. Funnel plots visualize the distribution of study effect sizes, with potential bias indicated by an uneven distribution, especially among smaller studies. The speaker guides through the process of generating a funnel plot, adjusting for the random effects model, and interpreting the plot to assess the likelihood of missing studies, which could suggest publication bias.
🔄 Addressing Publication Bias with Trim and Fill Analysis
This section introduces the trim and fill procedure, a method for adjusting meta-analysis results to account for potential publication bias. The speaker demonstrates how to use CMA to conduct this analysis, which imputes and includes missing studies in the analysis to provide a more balanced view. The results before and after the trim and fill procedure are compared to assess the impact of potential missing studies on the overall effect size estimate.
📊 Exploring Heterogeneity with Subgroup Analysis and Meta-Regression
The speaker discusses the importance of subgroup analysis and meta-regression in exploring heterogeneity and identifying factors that may explain variations in effect sizes. The process involves categorizing studies into subgroups based on specific variables, such as the inclusion or exclusion of substance abuse disorder (SUD) patients, and analyzing the impact of these variables on the effect size. The results of subgroup analyses can provide insights into the factors contributing to the observed heterogeneity.
📈 Meta-Regression Analysis with Continuous Moderators
This paragraph focuses on meta-regression analysis, which is used to examine the relationship between continuous moderators and effect sizes. The speaker demonstrates how to use CMA to conduct a meta-regression, including selecting the covariate, in this case, dosage, and interpreting the results. The analysis shows the predicted change in effect size with varying dosages, providing insights into the impact of dosage on the treatment's effectiveness.
📉 Interpreting Meta-Regression Results and Their Limitations
The speaker concludes the workshop by summarizing the key findings from the meta-regression analysis. They emphasize the importance of understanding the relationship between dose and effect size, as well as the limitations of the analysis, such as the inability to draw causal conclusions from subgroup comparisons. The speaker also discusses the implications of the findings for future research and clinical decision-making.
Mindmap
Keywords
💡Meta-analysis
💡Standardized Mean Difference
💡Effect Size
💡Heterogeneity
💡Random Effects Model
💡Fixed Effect Model
💡Publication Bias
💡Subgroups Analysis
💡Meta-Regression
💡Confidence Interval
💡Prediction Interval
💡Sensitivity Analysis
💡CMA (Comprehensive Meta-Analysis)
💡Trim and Fill Procedure
Highlights
Introduction to a workshop on meta-analysis, covering basic and advanced topics such as data entry, analysis running, effect size estimation, heterogeneity understanding, and result reporting.
Use of Comprehensive Meta-Analysis (CMA) software for conducting meta-analysis, available for free trial on metaanalysis.com.
Inclusion of 17 studies in the analysis examining the impact of methylphenidate on cognitive function in adults with ADHD.
All studies in the analysis were randomized controlled trials, providing a robust basis for the meta-analysis.
Data organization in Excel and subsequent transfer to CMA, emphasizing the importance of correctly identifying column functions.
Explanation of standardized mean difference (Cohen's d) as the effect size index for the analysis.
Guidance on how to interpret and report the results of a meta-analysis, including the significance of confidence intervals and p-values.
Discussion on heterogeneity, emphasizing its importance and common misconceptions about its interpretation.
Demonstration of subgroup analysis to explore the impact of different variables like substance abuse disorder on effect size.
Meta regression analysis to examine the relationship between continuous moderators, such as dose, and effect size.
Assessment of publication bias using funnel plots and the trim and fill procedure to adjust for potential missing studies.
Sensitivity analysis to ensure the robustness of results and check for the influence of individual studies on the overall effect size.
Importance of considering the clinical significance of effect sizes and the wide prediction interval in the context of patient impact.
Differentiation between fixed effect and random effects models, and the rationale for choosing the random effects model for generalizability.
Introduction of mixed effects analysis for understanding both within-subgroup variations and between-subgroup differences.
Final conclusions drawn from the meta-analysis, emphasizing the moderate effect size of methylphenidate on cognitive function and the factors influencing this effect.
Contact information provided for Michael Borenstein, offering assistance and further resources on meta-analysis.
Transcripts
Browse More Related Video


5.0 / 5 (0 votes)
Thanks for rating: