FDR, q-values vs p-values: multiple testing simply explained!
TLDRThe video script discusses the common problem of multiple testing in biostatistics, which increases the likelihood of false positives. It explains the concept using the analogy of testing Smarties colors for a correlation with baldness, highlighting how a p-value of 0.05 can lead to false correlations. The script then introduces the Bonferroni correction, a method to adjust the p-value threshold to reduce false positives but which can also increase false negatives by demanding stronger correlations. To address this, the script presents the False Discovery Rate (FDR) approach, which controls the expected proportion of false positives among significant results. The Benjamini-Hochberg procedure and Q values are introduced as methods to control the FDR, allowing researchers to balance the trade-off between false positives and false negatives. The video concludes by emphasizing the utility of Q values in exploratory analyses, such as genomics, where it's crucial to identify potential interesting genes without being overwhelmed by false positives.
Takeaways
- 🧐 The script discusses the problem of multiple testing in biostatistics, which can lead to an increased chance of false positives.
- 🎨 It uses the analogy of Smarties colors and baldness to illustrate how multiple comparisons can result in false correlations.
- 🔍 The script explains that with a p-value of 0.05, there's a 5% chance of a false positive, which becomes significant when testing thousands of variables.
- 🛠️ The Bonferroni correction is introduced as a common method to correct for multiple comparisons by dividing the p-value threshold by the number of tests.
- 📉 The Bonferroni correction is criticized for being too conservative, potentially leading to a high number of false negatives by demanding stronger correlations.
- 🏖️ An example with beach objects is used to demonstrate the effect of the Bonferroni correction and how it can lead to the loss of interesting but less strongly correlated variables.
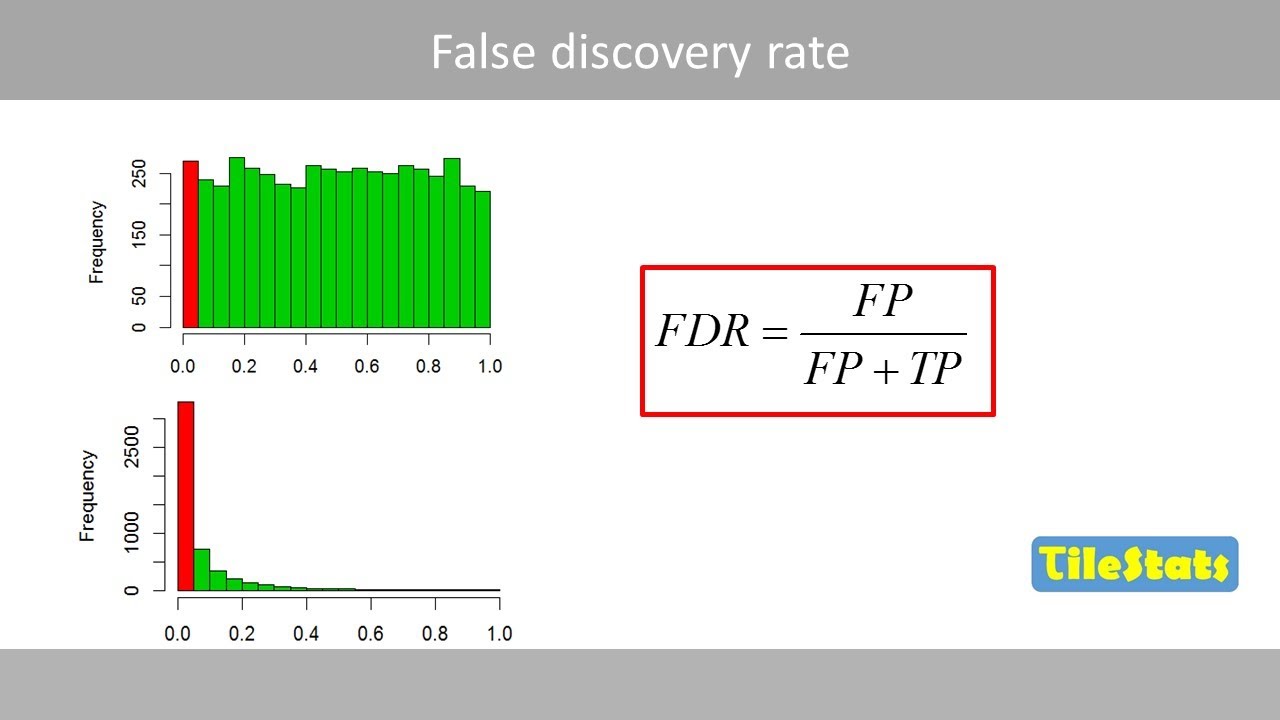
- 📈 The script introduces the concept of False Discovery Rate (FDR), which is the proportion of false positives among all significant results.
- 🛑 The Benjamini-Hochberg procedure and Q values are presented as methods to control the FDR, offering a more balanced approach to managing false positives and negatives.
- 🔄 Adjusted p-values, such as Q values, allow researchers to decide the acceptable level of false positives among significant results.
- 🔬 The use of Q values is highlighted as particularly useful in large-scale studies like genomics, where researchers want to make many discoveries and filter out false positives later.
- 👍 The video aims to provide a clear explanation of multiple testing and its corrections, inviting feedback and suggestions for future topics.
Q & A
What is the main problem discussed in the video?
-The main problem discussed in the video is the issue of multiple testing in biostatistics, which can lead to an increased chance of false positives.
Why can multiple testing lead to false positives?
-Multiple testing can lead to false positives because as the number of comparisons increases, so does the chance of observing at least one significant result by random chance, even if it is not actually significant.
What is the p-value and what does a p-value of 0.05 signify?
-The p-value is a measure used in statistics to determine the probability that an observed result occurred by chance. A p-value of 0.05 means there is a 5% chance that the observed result is a false positive.
What is the Bonferroni correction method and how does it work?
-The Bonferroni correction is a statistical technique used to adjust p-values to account for multiple comparisons. It suggests using a p-value threshold of P lower than 0.05 divided by the number of comparisons (n), to reduce the chances of false positives.
How does the Bonferroni correction affect the chances of false negatives?
-The Bonferroni correction is conservative, which means it significantly reduces the chances of false positives but at the cost of increasing the chances of false negatives, potentially missing out on interesting correlations that are less strong but still existent.
What is the False Discovery Rate (FDR) and why is it important?
-The False Discovery Rate (FDR) is the proportion of false positives among all significant results. It is important because it allows researchers to control the expected proportion of false positives in their findings, which is crucial for maintaining the validity of results in large-scale studies.
What is the Benjamini-Hochberg (BH) procedure and how does it relate to FDR?
-The Benjamini-Hochberg procedure is a method proposed to control the FDR. It provides a way to adjust p-values so that the expected proportion of false positives among the significant results is controlled, thus addressing the issue of multiple testing more effectively than the Bonferroni correction.
What is a Q-value and how does it differ from a p-value?
-A Q-value is an adjusted p-value obtained through methods like the BH procedure or its more powerful counterpart, which is designed to control the FDR. Unlike the p-value, which is the probability of observing a result by chance, the Q-value helps in deciding the acceptable number of false positives among significant results.
In what type of analysis would using Q-values be particularly useful?
-Using Q-values is particularly useful in exploratory or pilot studies where the goal is to make many discoveries that can be further filtered out later on, such as in genomics where researchers might want to find genes correlated with a disease without losing potentially interesting ones.
What is the significance of setting a Q-value threshold and how does it affect the analysis?
-Setting a Q-value threshold allows researchers to decide how many false positives they are willing to accept among the significant results. This affects the analysis by balancing the trade-off between finding true positives and avoiding false positives, depending on the stringency required for the study.
Outlines
🧐 Introduction to Multiple Testing Problem
This paragraph introduces the concept of multiple testing, a common issue in biostatistics where making numerous comparisons increases the risk of false positives. The video uses the analogy of Smarties and baldness to illustrate this problem, explaining how a p-value of 0.05 can lead to a 5% chance of a false positive. The paragraph emphasizes the need for techniques to correct for this issue, such as the Bonferroni correction, which adjusts the p-value threshold based on the number of tests conducted.
🔍 Exploring Solutions to Multiple Testing
The second paragraph delves into solutions for the multiple testing problem. It critiques the Bonferroni correction for being too conservative, potentially leading to many false negatives by requiring stronger correlations for statistical significance. The paragraph then introduces the concept of False Discovery Rate (FDR) and methods to control it, such as the Benjamini-Hochberg procedure and Q values. These methods aim to balance the number of false positives with the desire to make many discoveries, which is particularly useful in large-scale studies like genomics. The paragraph concludes by explaining how Q values allow researchers to set a threshold for acceptable false positives among significant results.
Mindmap
Keywords
💡Multiple Testing
💡False Positive
💡P-value
💡Bonferroni Correction
💡False Negative
💡False Discovery Rate (FDR)
💡Benjamini-Hochberg Procedure
💡Q-value
💡Statistical Significance
💡Genomics
Highlights
The video discusses a major issue in biostatistics known as multiple testing.
Multiple testing increases the chances of false positives due to the higher number of comparisons made.
An example is given using Smarties colors and their false positive correlation with baldness at a p-value of 0.05.
The Bonferroni correction method is introduced to adjust p-value thresholds for multiple comparisons.
The Bonferroni correction can be too conservative, leading to an increase in false negatives.
An alternative to the Bonferroni correction is the False Discovery Rate (FDR) which focuses on the proportion of false positives among significant results.
The Benjamini-Hochberg procedure is mentioned as a method to control the FDR.
Q values are introduced as a more powerful approach to controlling the FDR than the Benjamini-Hochberg procedure.
Q values allow researchers to decide the acceptable number of false positives among significant results.
The video provides a beach-related example to illustrate the concept of Q values and FDR.
Using Q values is particularly useful in large-scale analyses like genomics where many discoveries are made for later filtering.
The video emphasizes the importance of balancing the need to avoid false positives without missing potentially interesting genes.
The presenter suggests that the choice of threshold for Q values depends on the type of analysis and researcher's tolerance for false positives.
The video concludes by summarizing the key points about multiple testing and the use of Q values for correction.
The presenter invites feedback and suggestions for future topics to cover in the series.
The video is designed to provide a clear explanation of multiple testing and its correction methods in biostatistics.
Transcripts

5.0 / 5 (0 votes)
Thanks for rating: