Algebra Basics: What Are Functions? - Math Antics
TLDRIn this Math Antics lesson, Rob introduces the concept of functions in algebra, explaining how they relate one set to another in a specific way. Functions map inputs from a 'domain' to outputs in a 'range', often represented by mathematical equations. The lesson clarifies that a true function assigns exactly one output to each input, disqualifying 'one-to-many' relations. Various examples, including a linear function and the concept of function notation, are used to illustrate the principles, emphasizing the importance of the Vertical Line Test to validate functions and their graphical representation on the coordinate plane.
Takeaways
- 📚 A function in math is a relationship between two sets, the domain (input set) and the range (output set).
- 🔢 Sets can be finite or infinite collections of items, often numbers but not limited to them.
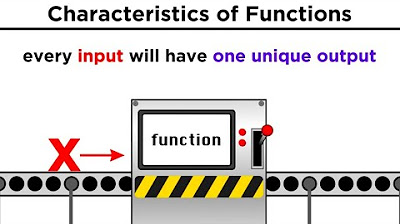
- 📈 Functions map each input value to exactly one output value, following a specific rule or equation.
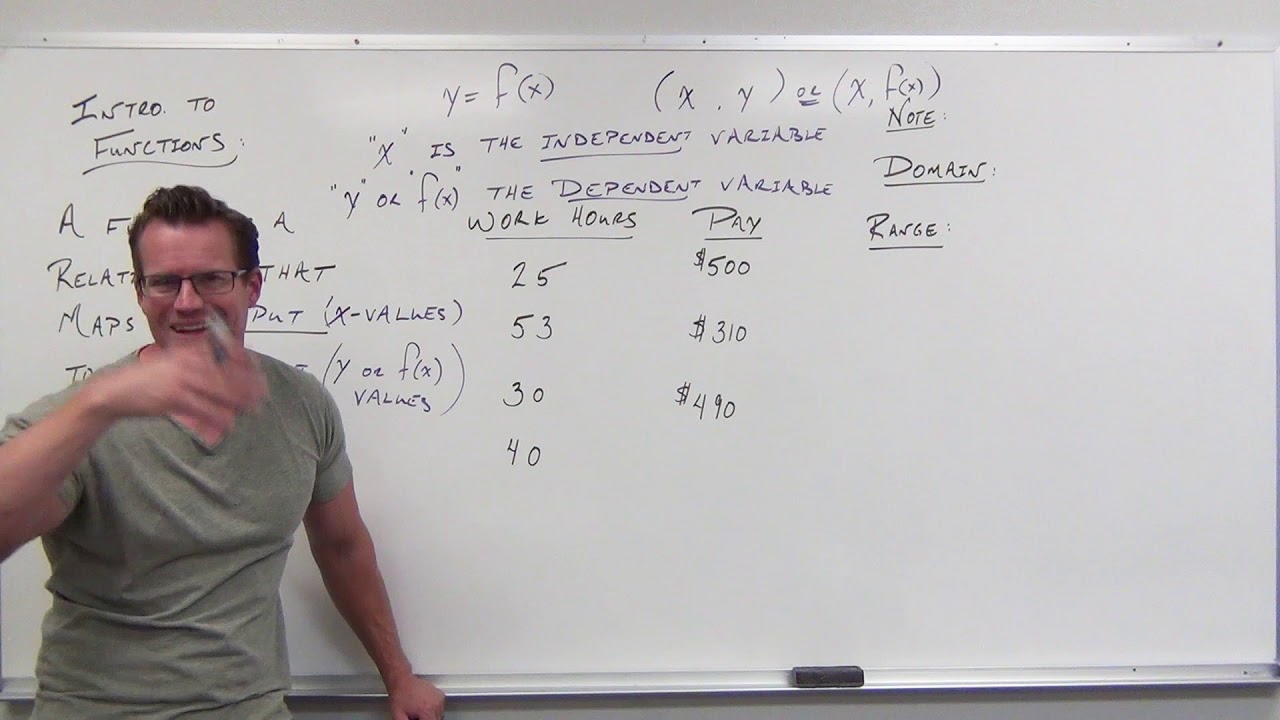
- 📊 A function table displays inputs and their corresponding outputs in columns, illustrating the function's behavior.
- 🏳️🌈 The domain and range of a function can be represented visually on a coordinate plane using ordered pairs.
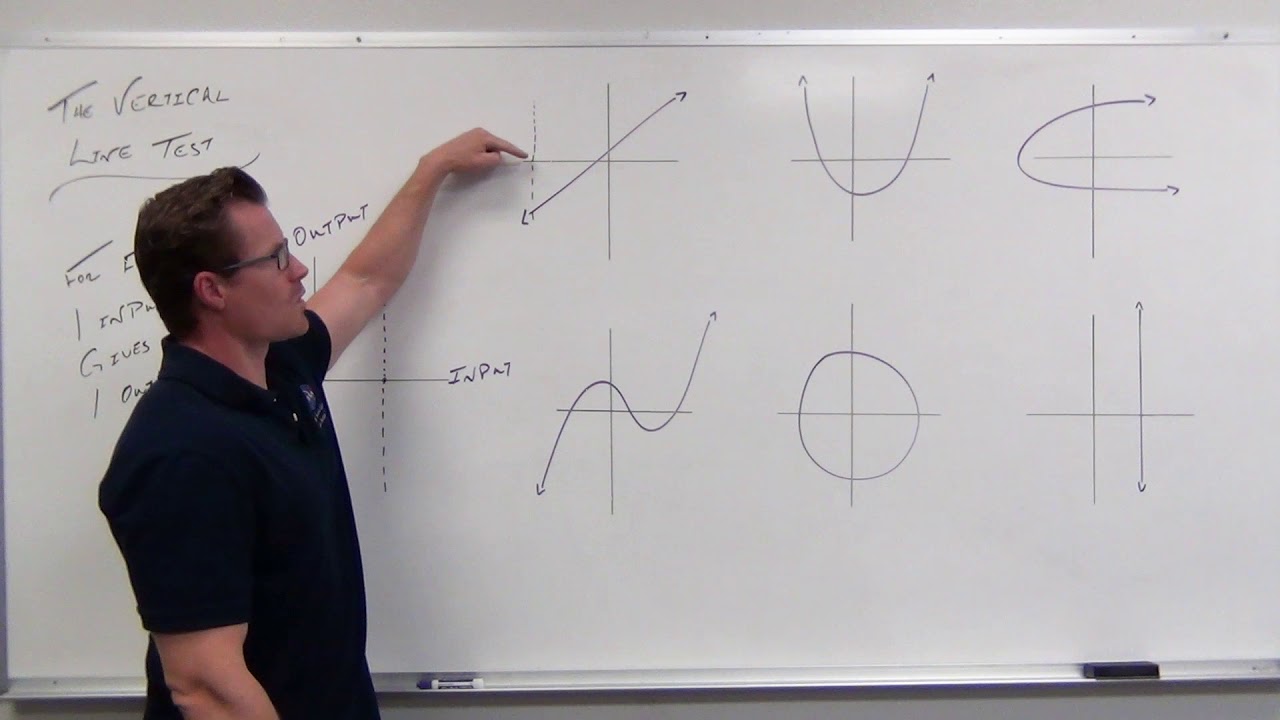
- 🔍 The 'Vertical Line Test' is used to determine if a graph represents a function by checking for one output per input across the domain.
- 📌 Functions in algebra often take the form of equations and can be graphed on a coordinate plane.
- 🔢 The general form of a linear function is y = mx + b, where m is the slope and b is the y-intercept.
- 📝 Functions can be represented using function notation, such as f(x), to emphasize the input-output relationship.
- 👉 You can evaluate a function for specific input values by substituting the value into the function's equation.
- 📖 Understanding functions is fundamental to algebra and allows for solving a variety of mathematical problems.
Q & A
What is the definition of a function in mathematics?
-In mathematics, a function is a relation that connects one set to another set in a specific way. It takes each value from an input set (the domain) and relates it to a value in an output set (the range).
How are sets represented visually and notationally?
-Visually, sets can be shown as a collection of items, while notationally, they are often written inside curly brackets with commas separating the elements, like {1, 2, 3}.
What are the two sets involved in a function called?
-The two sets involved in a function are called the input set (or domain) and the output set (or range).
What is a function table and how is it structured?
-A function table is a table that displays the relationship between inputs and outputs of a function. It typically has two columns: one for input values on the left and one for the corresponding output values on the right.
How does the function in the polygon example relate inputs to outputs?
-In the polygon example, the function relates the name of a polygon to the number of its sides. For instance, if the input is 'triangle', the output is 3, and if the input is 'square', the output is 4.
What is the main characteristic of a function that distinguishes it from other relations?
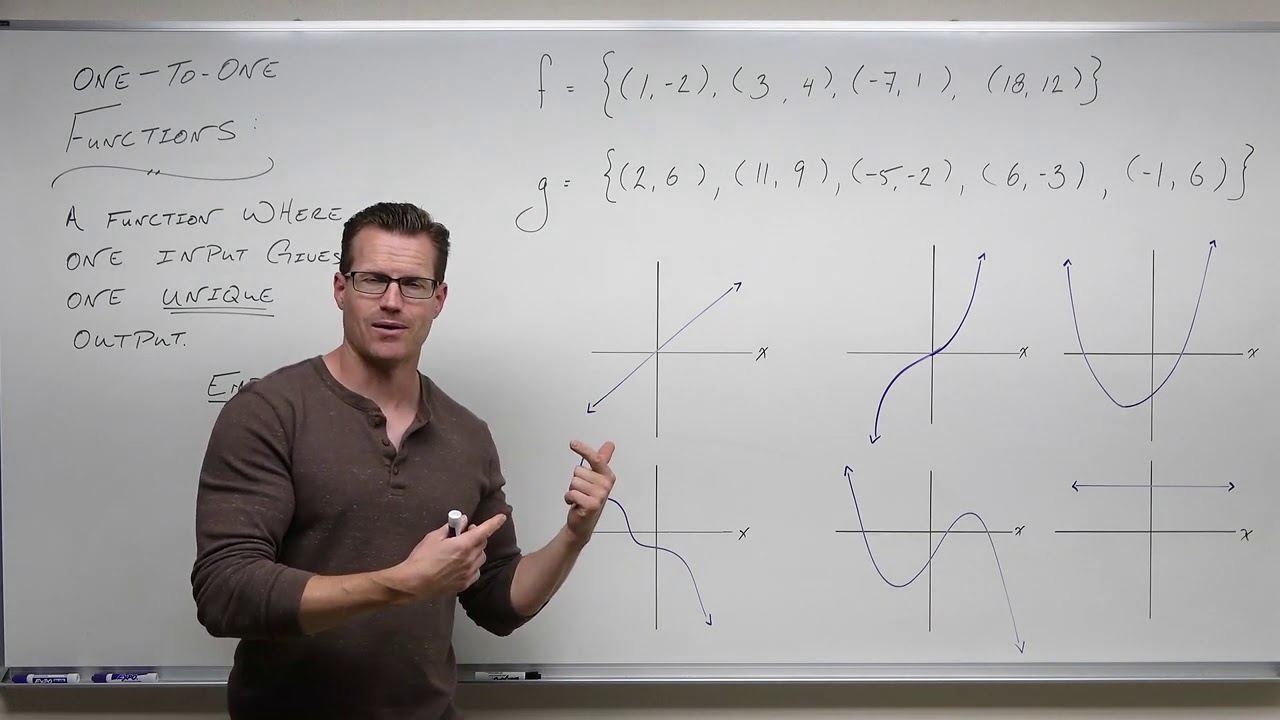
-A function must produce exactly one output value for each input value. This means it cannot have a 'one-to-many' relation where one input value results in multiple output values.
How can you determine if a graph represents a function using the Vertical Line Test?
-If a vertical line intersects the graph at exactly one point for every possible value of 'x' in the domain, then the graph represents a function. If it intersects at more than one point for some 'x' values, it is not a function.
What is the purpose of function notation, such as f(x)?
-Function notation, like f(x), is a way to represent a function with a specific input variable (x) and to indicate that 'f' is the name of the function, not a variable being multiplied by 'x'. It also allows for easy evaluation of the function for specific input values.
How can you evaluate a function for a specific input value?
-To evaluate a function for a specific input value, you replace the input variable (usually 'x') with the given value in the function's equation. For example, for the function f(x) = 3x + 2, f(4) would be calculated as 3*4 + 2, which equals 14.
What is a linear function and what does its graph look like?
-A linear function is a type of function that has a graph that forms a straight line when plotted on a coordinate plane. An example of a linear function is y = 2x + 1.
What are some other types of functions encountered in Algebra?
-In Algebra, other types of functions include quadratic functions, cubic functions, and trigonometric functions, all of which have distinctive graphs that can be identified and analyzed.
What is the domain of the function in the video that does not qualify as a function?
-The domain of the function y^2 = x does not include negative input values. For positive input values, it can produce two possible output values, which is why it does not qualify as a function.
Outlines
📚 Introduction to Functions and Sets
This paragraph introduces the concept of functions in mathematics, explaining that a function is a relationship between two sets. It defines a set as a collection of things, which can be numbers or other items, and distinguishes between finite and infinite sets. The paragraph further clarifies the input set (domain) and output set (range) of a function, using the example of a function that maps polygon names to the number of their sides. It also introduces the concept of a function table and basic algebraic functions, emphasizing the rule that a function must map each input to a unique output, disqualifying 'one-to-many' relationships.
🔍 Understanding Function Properties and Notation
The second paragraph delves into the properties of functions, emphasizing the requirement for each input to have exactly one output, thus defining a 'one-to-one' relationship. It uses the example of the equation y = x + 1 to illustrate a valid function and contrasts it with the equation y squared equals x, which is not a function due to its 'one-to-many' output. The paragraph also explains how functions can be graphed on a coordinate plane and introduces the Vertical Line Test as a method to verify if a graph represents a function. Additionally, it clarifies common function notation, such as f(x) = y, and explains the interchangeable use of 'y' and f(x) in representing the output of a function.
📈 Graphing Functions and Evaluating Specific Values
The final paragraph discusses the graphical representation of functions, focusing on how different types of functions, including linear, quadratic, cubic, and trigonometric functions, can be plotted on a coordinate plane. It reinforces the concept of the Vertical Line Test as a tool to confirm if a graph represents a function. The paragraph then addresses the use of function notation, particularly the f(x) notation, and explains its purpose in emphasizing the function's relationship with specific input variables. It also demonstrates how to evaluate a function for particular input values, providing examples with the function f(x) = 3x + 2. The paragraph concludes by summarizing the definition of functions and their key components, such as domain and range, and encourages practice with the concepts introduced.
Mindmap
Keywords
💡Functions
💡Sets
💡Domain
💡Range
💡Function Table
💡Algebraic Equation
💡Graph
💡Vertical Line Test
💡One-to-Many Relation
💡Function Notation
💡Ordered Pair
Highlights
In math, a function is something that relates or connects one set to another set in a particular way.
A set is a group or collection of things, often a collection of numbers.
A function takes each value from an input set (the domain) and relates it to a value in an output set (the range).
Functions are often represented in a function table with two columns, one for input values and one for output values.
The function in the example relates the name of a polygon to its number of sides.
Algebraic functions usually relate one variable to another in the form of an equation, like y = 2x.
For each input value, the output value is twice as big in the function y = 2x.
Functions are not allowed to have 'one-to-many' relations, where one input value could result in many different output values.
A function produces only one output value for each input value, relating a member of the input set to exactly one member of the output set.
The equation y = x + 1 is an example of a linear function, which graphs as a straight line on the coordinate plane.
There are various types of functions in Algebra with interesting graphs, such as quadratic, cubic, and trigonometric functions.
The Vertical Line Test helps determine if a graph is a function by checking if a vertical line intersects the graph at exactly one point for every 'x' value in the domain.
Functions can be represented using function notation, such as f(x) = y, where 'f' is the name of the function, 'x' is the input, and 'y' is the output.
The interchangeable use of f(x) and 'y' in function notation highlights dealing with a function and allows for easy evaluation of the function for specific input values.
The basic concept of a function in math is that it relates an input value to exactly one output value.
The domain is the set of all input values for a function, and the range is the set of output values.
Algebraic functions can be graphed on the coordinate plane by treating input and output values as ordered pairs.
The video provides a basic introduction to functions, which is essential for working with them in Algebra.
Transcripts
Browse More Related Video
Introduction to Functions (Precalculus - College Algebra 2)
Back to Algebra: What are Functions?
One to One Functions (Precalculus - College Algebra 50)

Calculus made EASY! 5 Concepts you MUST KNOW before taking calculus!
Using the Vertical Line Test (Precalculus - College Algebra 6)

Relations, Mappings & Functions.
5.0 / 5 (0 votes)
Thanks for rating: