False Discovery Rates, FDR, clearly explained
TLDRIn this episode of StatQuest, the focus is on understanding False Discovery Rates (FDR), a crucial concept in high-throughput sequencing. The video explains FDR as a tool for filtering out bad data that appears good, using RNA sequencing as an example. It illustrates how p-values are used to determine statistical significance, and how a large number of tests can lead to a high rate of false positives. The Benjamini-Hochberg method is introduced as a way to control the false discovery rate by adjusting p-values, ensuring that no more than a certain percentage of significant results are false positives. The explanation includes a step-by-step guide on how to adjust p-values using this method, making it accessible to viewers who may not be familiar with the concept.
Takeaways
- 🧬 False Discovery Rates (FDR) are tools used to filter out bad data that appears to be good, particularly in the context of high-throughput sequencing.
- 📊 The script uses an example of gene expression measurement via RNA sequencing to illustrate how FDR works.
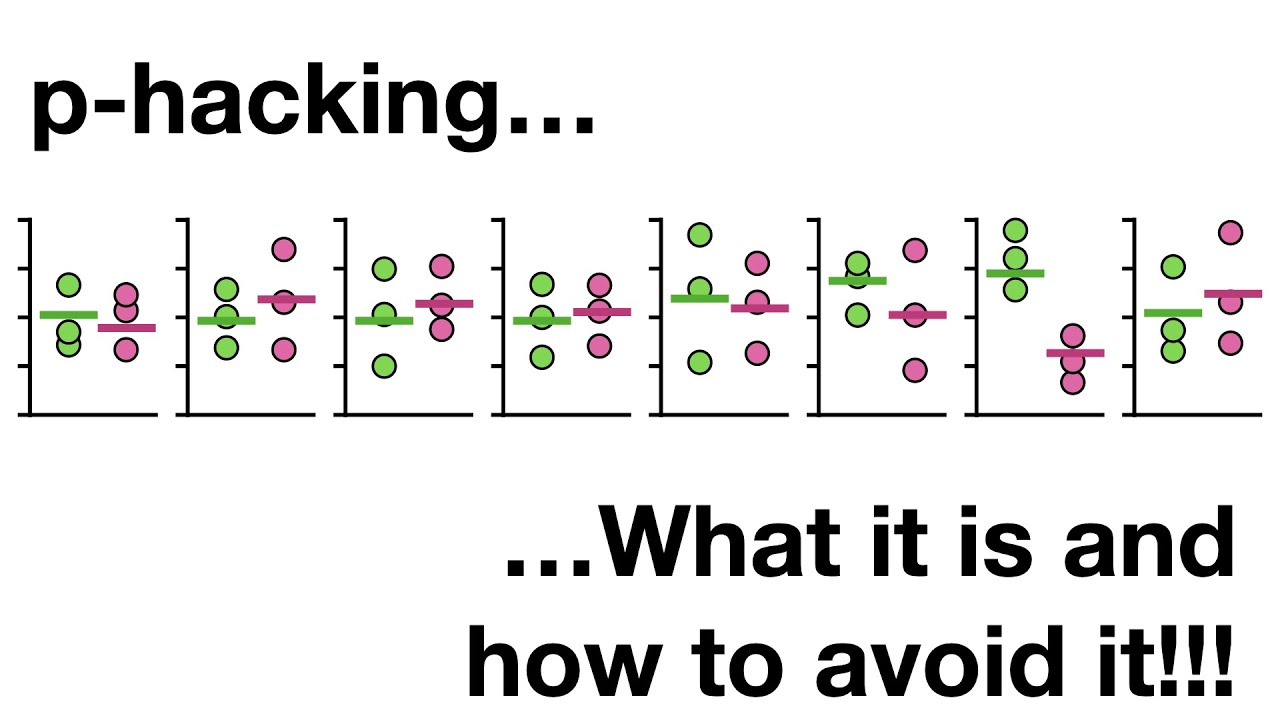
- 🐁 It explains how RNA sequencing data from normal 'wild-type' mice can vary slightly between samples, leading to a bell-shaped distribution of gene expression measurements.
- 📉 The concept of p-values is introduced, where a large p-value (>0.05) indicates no significant difference between samples, and a small p-value indicates a false positive.
- 🔍 When comparing thousands of genes, the probability of false positives increases, which is where FDR becomes crucial to control the number of false positives.
- 🎯 The Benjamini-Hochberg method is highlighted as a specific approach to control the FDR, which is based on adjusting p-values to limit false positives.
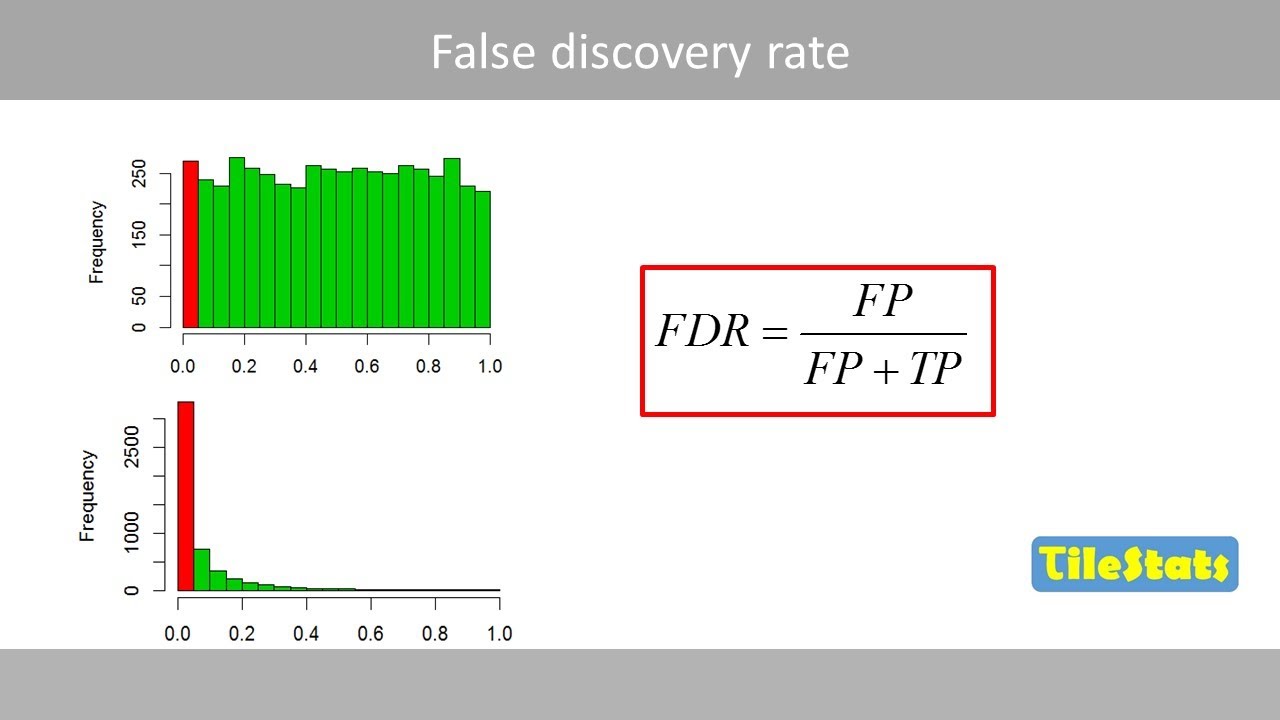
- 📚 The script explains that p-values from the same distribution are uniformly distributed, while those from different distributions are skewed towards zero.
- 📊 A histogram of p-values is used to visually differentiate between true and false positives, with the goal of identifying genes truly affected by a drug.
- 🤓 The Benjamini-Hochberg method mathematically formalizes the 'eyeball' method of adjusting p-values, ensuring that less than 5% of significant results are false positives.
- 🔢 The adjustment process involves ordering and ranking p-values, then applying a formula to determine the FDR-adjusted p-values, which are made larger if necessary.
- 🎯 The final takeaway is that the Benjamini-Hochberg method effectively separates true positives from false positives, ensuring scientific rigor in high-throughput sequencing analysis.
Q & A
What is the main purpose of False Discovery Rates (FDR) in high-throughput sequencing?
-The main purpose of False Discovery Rates (FDR) is to weed out bad data that appears to be good, helping to control the number of false positives in high-throughput sequencing.
What is a p-value and why is it significant in statistical tests?
-A p-value is a measure used in statistical tests to determine the probability that the observed results occurred by chance. It is significant because a p-value less than a certain threshold (commonly 0.05) suggests that the samples are from different distributions, indicating a statistically significant result.
Why do we need to control for false positives when comparing a large number of genes?
-When comparing a large number of genes, such as the 10,000 transcribed genes in human and mouse cells, the probability of encountering false positives increases. Controlling for false positives is necessary to ensure that the findings are meaningful and not due to random chance.
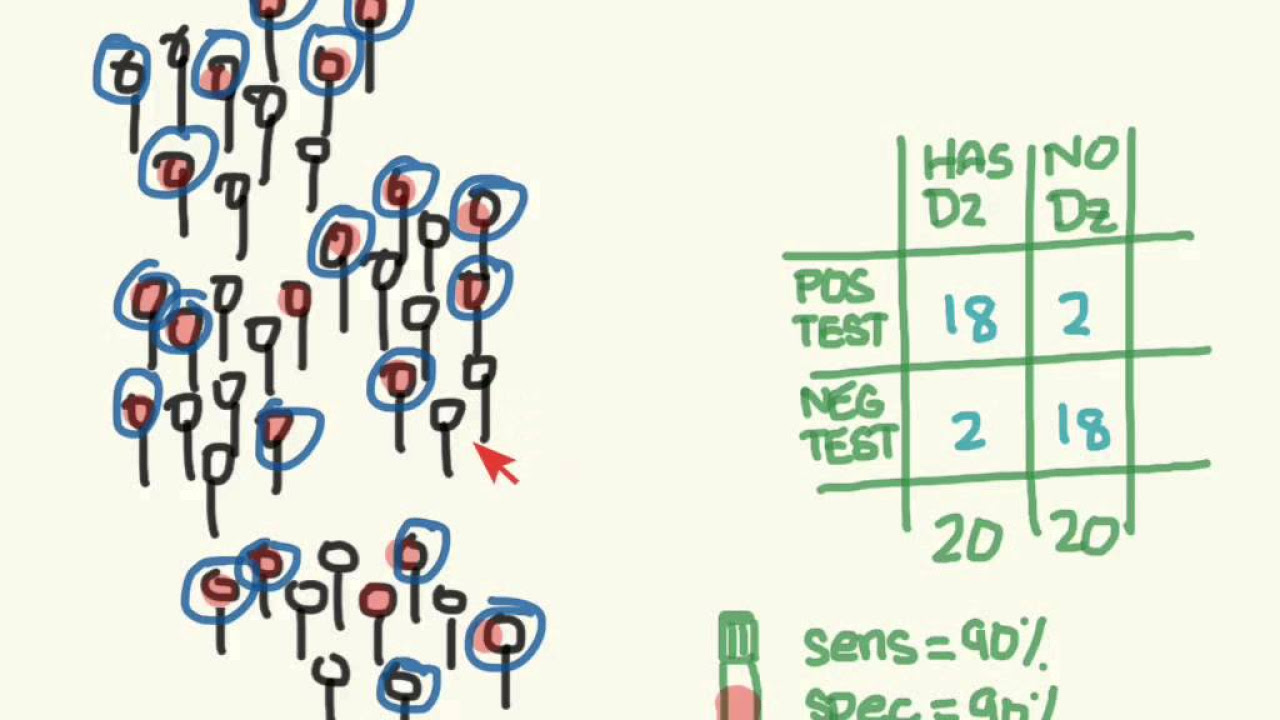
What is the difference between a false positive and a false negative in the context of statistical tests?
-A false positive occurs when the test suggests a significant difference when there is none, while a false negative occurs when the test fails to detect a significant difference that actually exists.
What is the Benjamini-Hochberg method and how does it relate to FDR?
-The Benjamini-Hochberg method is a statistical technique used to control the false discovery rate (FDR). It adjusts p-values to limit the number of false positives reported as significant, ensuring that a specified proportion of the rejected hypotheses are true positives.
How does the distribution of p-values differ when samples come from the same distribution versus different distributions?
-When samples come from the same distribution, p-values are uniformly distributed across all values. However, when samples come from different distributions, p-values are skewed towards zero, indicating a higher likelihood of statistical significance.
What is the concept of 'eyeballing' in the context of identifying true positives and false positives?
-In the context of identifying true positives and false positives, 'eyeballing' refers to the visual inspection method of drawing a line at the top of the uniformly distributed p-values and extending it to separate the false positives from the true positives.
How does the Benjamini-Hochberg method adjust p-values to control for false positives?
-The Benjamini-Hochberg method adjusts p-values by ranking them and creating new FDR-adjusted p-values. It uses a mathematical formula to ensure that the proportion of false positives among the significant results is controlled at a specified level, typically less than 5%.
Why might some true positive genes not have adjusted FDR p-values less than 0.05 after the Benjamini-Hochberg method?
-Some true positive genes might not have adjusted FDR p-values less than 0.05 because not all true positive genes will have extremely small p-values. The adjustment process may result in some true positives having p-values that are no longer significant after the FDR correction.
What is the significance of the cutoff value in the Benjamini-Hochberg method?
-The cutoff value in the Benjamini-Hochberg method is significant because it determines the threshold for considering a result as significant. By setting a cutoff value, researchers can control the expected proportion of false positives among the significant findings.
Outlines
🌟 Introduction to False Discovery Rates (FDR)
The video begins with an introduction to the concept of false discovery rates (FDR), a statistical tool used in high-throughput sequencing to filter out unreliable data that appears significant. The presenter uses the example of RNA sequencing to explain how gene expression measurements can vary between samples, and how a bell-shaped curve can represent the distribution of these measurements. The main idea is that FDR helps to identify true positive results amidst a large number of tests, where a small p-value (<0.05) can indicate a false positive if the samples are from the same distribution. The example of comparing gene expression in normal and drug-treated mice is used to illustrate the point, and the potential issue of a high number of false positives when testing many genes is highlighted.
🔍 Understanding the Benjamini-Hochberg Method for FDR
This paragraph delves into the Benjamini-Hochberg method, a specific approach to control the FDR. The method is based on generating a large number of p-values from samples taken from the same distribution, and observing their distribution in a histogram. The presenter explains that when samples come from the same distribution, p-values are uniformly distributed, whereas when they come from different distributions, p-values are skewed towards zero. The goal is to distinguish between true positives (genes affected by a drug) and false positives by analyzing the distribution of p-values. The Benjamini-Hochberg method mathematically formalizes the 'eyeball' method of drawing a line to separate true from false positives based on the distribution of p-values.
📊 The Distribution of P-Values and the Role of FDR
The script continues with a detailed explanation of how p-values are distributed when samples are taken from both the same and different distributions. It uses a hypothetical experiment involving the testing of neuronal cell genes, some of which are affected by a drug and others that are not. The histogram of p-values from all genes is a combination of two separate distributions, and the challenge is to identify the true positives among the skewed p-values. The Benjamini-Hochberg method is introduced as a way to adjust p-values to limit false positives, with a mathematical formula that ensures that less than 5% of significant results will be false positives.
📚 Detailed Explanation of the Benjamini-Hochberg FDR Adjustment
The final paragraph provides a step-by-step breakdown of the Benjamini-Hochberg method, starting with ordering p-values and adjusting them based on a formula that involves the total number of p-values and their rank. The method ensures that the adjusted p-values for true positives remain significant while those for false positives are increased to be above the significance threshold. The presenter uses a large example with p-values represented in boxes to demonstrate how the method works in practice, showing that after adjustment, all true positives have p-values less than 0.05, while the false positives are adjusted to be greater than 0.05, effectively controlling the false discovery rate.
Mindmap
Keywords
💡False Discovery Rate (FDR)
💡Gene Expression
💡RNA Sequencing
💡P-Value
💡Bell-Shaped Curve
💡Benjamini-Hochberg Method
💡False Positive
💡Transcribed Genes
💡Statistical Test
💡Uniform Distribution
💡Significance
Highlights
Stat Quest episode focuses on explaining False Discovery Rates (FDR).
FDR is a tool used to filter out bad data that appears good in high-throughput sequencing.
Introduction to an example of measuring gene expression using RNA sequencing.
Explanation of gene expression variability between different samples.
Illustration of how a normal distribution curve summarizes gene expression measurements.
Concept of p-values and their role in determining statistical significance.
Discussion on the occurrence of false positives in gene expression analysis.
The impact of testing multiple genes and the increase in false positives.
Introduction of the Benjamini-Hochberg method to control the false discovery rate.
Overview of generating p-values from samples taken from the same distribution.
Difference in p-value distribution when samples come from different distributions.
Explanation of how to visually identify true positives from false positives using histograms.
The mathematical formula behind the Benjamini-Hochberg method for FDR adjustment.
Process of adjusting p-values to limit the number of reported false positives.
Example of applying the Benjamini-Hochberg method to a set of p-values.
Demonstration of how the method effectively separates true positives from false positives.
Conclusion summarizing the importance and application of FDR in statistical analysis.
Transcripts


5.0 / 5 (0 votes)
Thanks for rating: