Statistics 101: Linear Regression, Algebra, Equations, and Patterns
TLDRThis video delves into the fundamentals of simple linear regression, emphasizing its connection to bivariate statistics and the algebra of lines. The instructor introduces key concepts and terminology, such as residuals, sum of squares, and the slope-intercept form of a line, to help viewers understand how the value of one variable can be a function of another. The video also discusses the three general forms of regression lines based on the slope's sign and value, and prepares viewers for the least squares method, which will be covered in the next installment of the series.
Takeaways
- 🌟 Stay positive and patient when facing challenges in learning statistics, as perseverance and practice can lead to understanding.
- 🎯 The video series aims to familiarize viewers with basic concepts of statistics, specifically simple linear regression.
- 🔍 Simple linear regression is part of bivariate statistics, dealing with two variables, and shares traits with correlation and ANOVA.
- 📈 Data points in regression and correlation are plotted on a scatterplot or coordinate plane, showing the relationship between two variables.
- 📊 The value of one variable in regression is a function of the other, typically denoted as y being a function of x (y = f(x)).
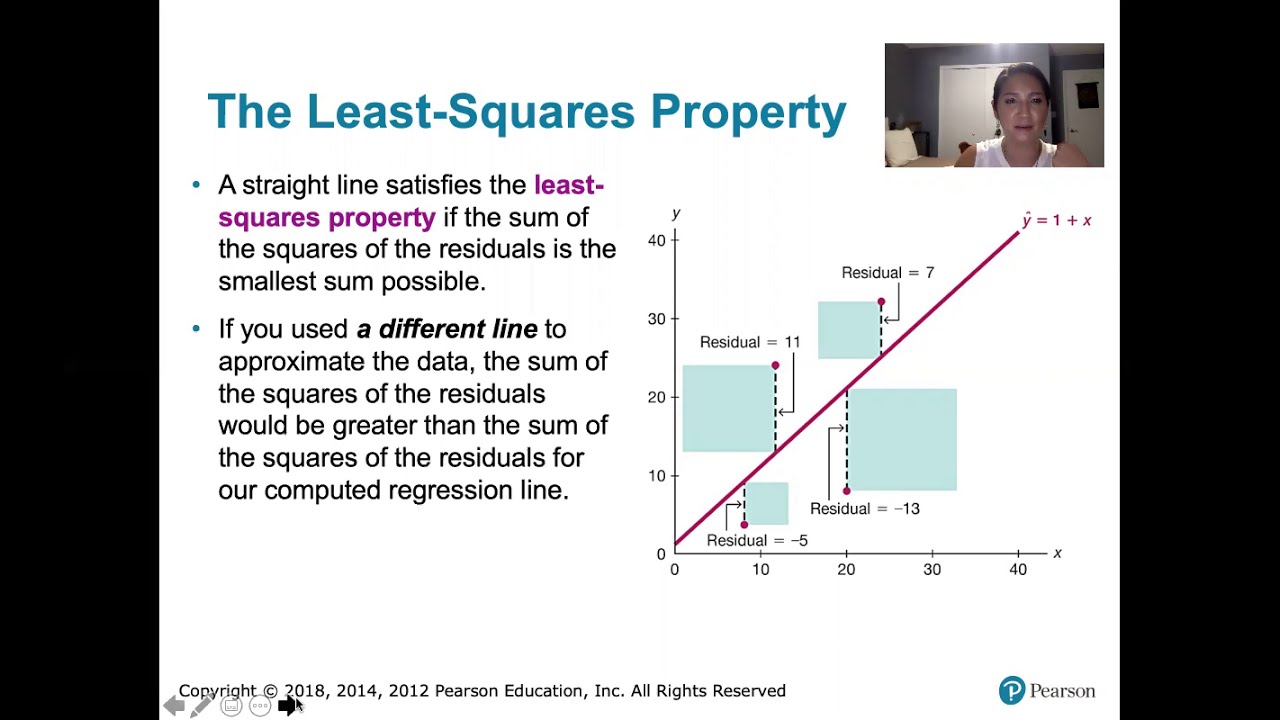
- 🤓 The goal of regression is to form a line through data points that minimizes the residual sum of squares, which is the difference between the observed values and the values predicted by the line.
- 📝 The algebra of lines, specifically the slope-intercept form (y = mx + b), is fundamental to understanding regression lines.
- 📌 The slope (m) represents the rise over run and the direction of the line, while the y-intercept (b) is where the line crosses the y-axis.
- 📈 The expected value of y is the mean of a distribution of y values for a given x, and it is an approximation rather than a single point.
- 📊 Regression lines can have three general forms based on the slope (beta sub-one): positive slope (upward), negative slope (downward), and zero slope (flat line).
- 🚀 The next video will introduce the least squares method for conducting simple linear regression and calculating the regression line by hand.
Q & A
What is the main theme of the video?
-The main theme of the video is to introduce the basics of simple linear regression, its relation to the algebra of lines, and how to interpret regression analysis.
What are the two key components of the slope-intercept form of a line?
-The two key components of the slope-intercept form of a line are the slope (m) and the y-intercept (b).
What does the slope represent in the context of a line?
-The slope (m) represents the rate of change of the dependent variable (y) with respect to the independent variable (x), often described as 'rise over run'.
What is the y-intercept in the context of a line?
-The y-intercept (b) is the point at which the line crosses the y-axis, which occurs when the value of x is zero, represented as (0, b) on the graph.
How is the concept of 'expected value' used in simple linear regression?
-In simple linear regression, the expected value of y represents the mean or average value of y for a given value of x, accounting for the potential distribution of y values around that mean.
What are the three general forms of regression lines based on the value of beta sub-one (the slope)?
-The three general forms of regression lines are: 1) a flat line with a slope of zero, 2) a line going upwards from the lower left to the upper right with a positive slope, and 3) a line going downwards from the top left to the lower right with a negative slope.
What is the purpose of comparing a regression line to a model where the slope is zero?
-Comparing a regression line to a model with a slope of zero helps to determine how well the regression line fits the data, as it provides a baseline of the simplest possible model without the independent variable's influence.
How does the instructor encourage viewers to engage with their content?
-The instructor encourages viewers to follow them on various social media platforms, share their videos, give thumbs up, and leave constructive comments to help improve future content.
What is the significance of scatter plots in understanding regression?
-Scatter plots are significant in understanding regression as they visually represent the relationship between two variables, allowing for the identification of patterns and the potential linear relationship that can be modeled through regression.
What is the least squares method mentioned in the video?
-The least squares method is a technique used in regression analysis to find the line that best fits the data by minimizing the sum of the squared differences (residuals) between the observed values and the values predicted by the line.
How does the instructor relate the concepts of correlation and ANOVA to simple linear regression?
-The instructor humorously suggests that if correlation and ANOVA 'got together and had a child,' that child would be simple linear regression, highlighting that regression shares traits with both correlation and ANOVA.
Outlines
📚 Introduction to Basic Statistics and Encouragement
The video begins with the instructor offering a warm welcome and encouragement for viewers who may be struggling with statistics. The instructor emphasizes the importance of maintaining a positive attitude and highlights that seeking help is a sign of intelligence and talent. They also invite viewers to follow their channels across various social media platforms for updates on new content and to foster a sense of community. The video aims to provide a foundational understanding of basic statistical concepts, specifically focusing on simple linear regression, in a slow and deliberate manner to ensure comprehension.
📈 Understanding Simple Linear Regression and its Terminology
In this segment, the instructor delves into the fundamentals of simple linear regression. They explain that regression is part of bivariate statistics, dealing with two variables. The instructor draws parallels between regression and other statistical concepts such as correlation and ANOVA, suggesting that regression shares traits with both. The focus is on the relationship between the dependent variable (y) and the independent variable (x), with the value of y being a function of x. The instructor also introduces the concept of scatter plots and how they are used in both correlation and regression to visualize data points and their relationships.
📊 Reviewing the Algebra of Lines and Regression Equations
The instructor provides a quick review of the algebra of lines, emphasizing the slope-intercept form (y = mx + b) as it is crucial for understanding regression lines. They explain the components of the equation, including the slope (m), which represents the rise over run, and the y-intercept (b), where the line crosses the y-axis. The instructor uses an example (y = 2x + 3) to illustrate how to identify the slope and y-intercept from a linear equation. They then connect this to the general form of a regression model (y = β₀ + β₁x + e), where β₀ is the y-intercept and β₁ is the slope of the population parameter.
📉 Discussing the Population Regression Model and Error Term
The instructor discusses the population regression model, which is an estimation of the overall population using sample data. They explain that the expected value of y (the mean of y for a given x) is represented by the population parameters β₀ and β₁. The instructor clarifies that the expected value is an approximation and is actually the mean of a distribution of y values for a given x. They introduce the concept of the error term (e), which represents the unexplained variation in the y variable. The instructor also explains that the goal of regression is to minimize this error term by finding the best-fit line through the data points.
📝 Applying Regression Concepts to a Real-world Example
The instructor applies the concepts of regression to a real-world example involving the relationship between the amount of a restaurant bill and the tip left by customers. They present data points and discuss how to graph these on a scatter plot. The instructor hypothesizes that a higher bill amount will generally result in a higher tip, suggesting a positive linear relationship. They also explain how the regression line can be used to visually represent this relationship and how it can be compared to a model that only uses the mean tip amount to determine its effectiveness. The instructor concludes by setting the stage for the next video, where the least squares method for calculating the regression line will be introduced.
Mindmap
Keywords
💡Statistics
💡Simple Linear Regression
💡Residuals
💡Sum of Squares
💡Algebra of Lines
💡Slope
💡Y-Intercept
💡Error Term
💡Expected Value
💡Least Squares Method
💡Scatter Plot
Highlights
The video is part of a series on basic statistics, aiming to help viewers understand and overcome challenges in their statistics classes.
The instructor encourages positivity and perseverance, reminding viewers of their intelligence and potential to overcome temporary setbacks.
The video focuses on simple linear regression, a fundamental concept in statistics that helps to understand the relationship between two variables.
Regression is related to the algebra of lines, and understanding this connection is crucial for interpreting regression analysis.
The instructor introduces the concept of residuals and the sum of squares, which are key in understanding the fit of a regression model.
The video explains the slope-intercept form of a line (y = mx + b), which is fundamental in expressing a regression line.
The y-intercept of a line is a significant point as it represents where the line crosses the y-axis, providing insight into the relationship between variables.
The general form of a regression model is y = β₀ + β₁x + ε, where β₀ is the y-intercept, β₁ is the slope, and ε is the error term.
The expected value of y is the mean of a distribution of y values for a given x, and it represents the best estimate of y based on the model.
Regression lines can have three general forms based on the slope (β₁): zero slope, positive slope, and negative slope.
The video emphasizes the importance of comparing the regression line to a model where the slope is zero, to assess the improvement in fit.
The instructor provides a practical example of tips received by waiters and waitresses, relating the tip amount to the bill amount to illustrate the concept of regression.
The video prepares viewers for conducting least squares regression, a method for finding the best-fitting line through a set of data points.
The instructor guides viewers on how to interpret the slope and y-intercept in the context of a real-world scenario, enhancing their understanding of the practical applications of regression.
The video concludes with a recap of the key concepts covered, reinforcing the importance of understanding the algebra of regression lines and the interpretation of regression models.
Transcripts
Browse More Related Video

Statistics 101: Linear Regression, The Least Squares Method
10.2.5 Regression - Residuals and the Least-Squares Property
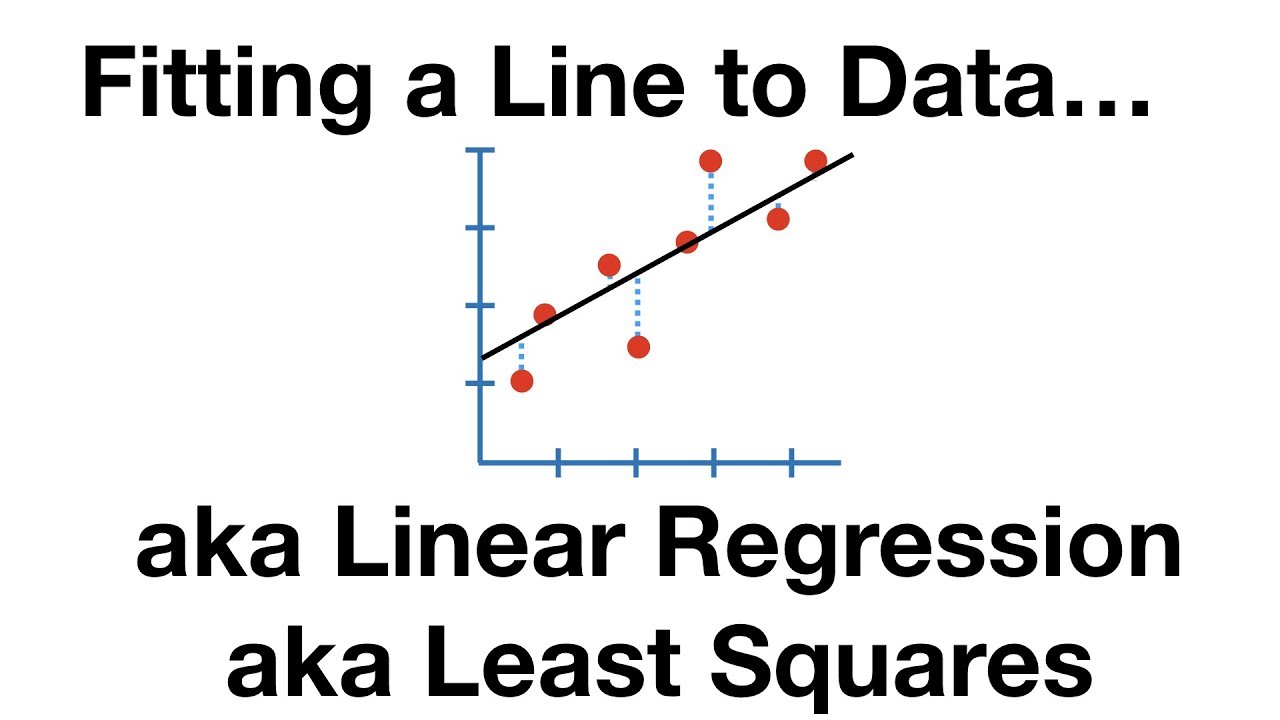
The Main Ideas of Fitting a Line to Data (The Main Ideas of Least Squares and Linear Regression.)
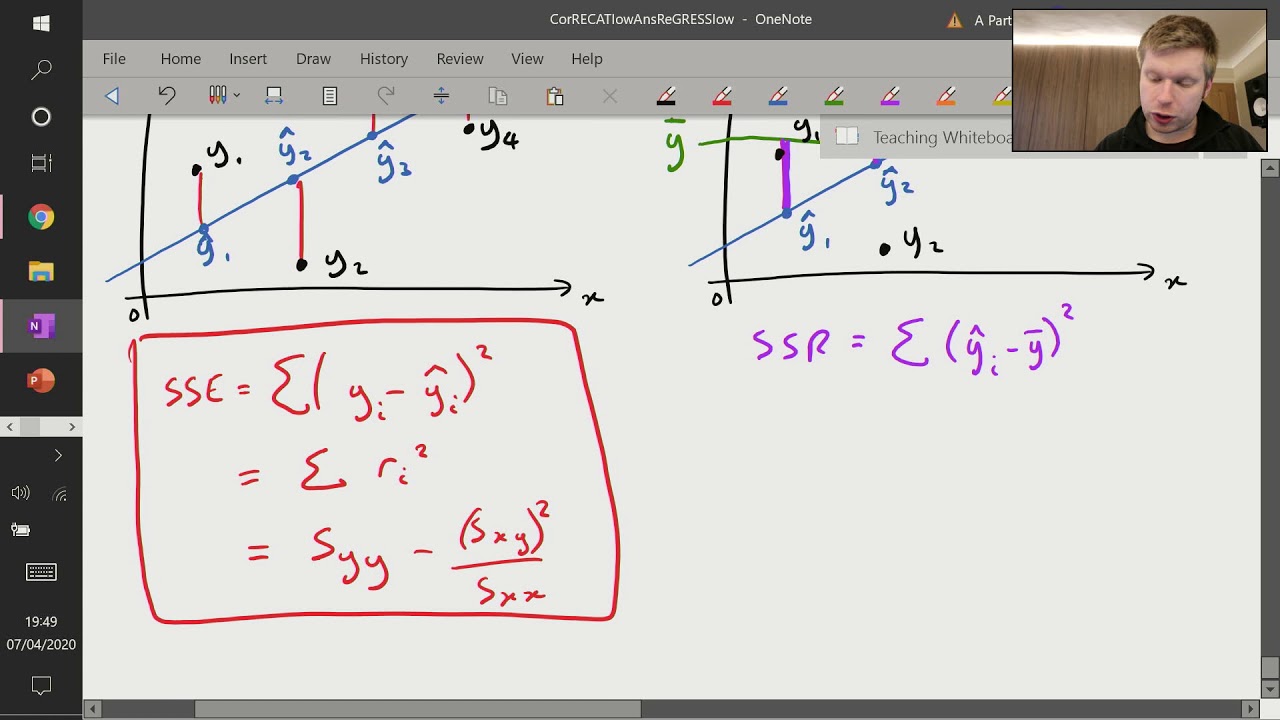
Correlation and Regression (6 of 9: Sum of Squares - SSE, SSR and SST)

HOW TO READ A COMPUTER OUTPUT FOR REGRESSION AP STATISTICS
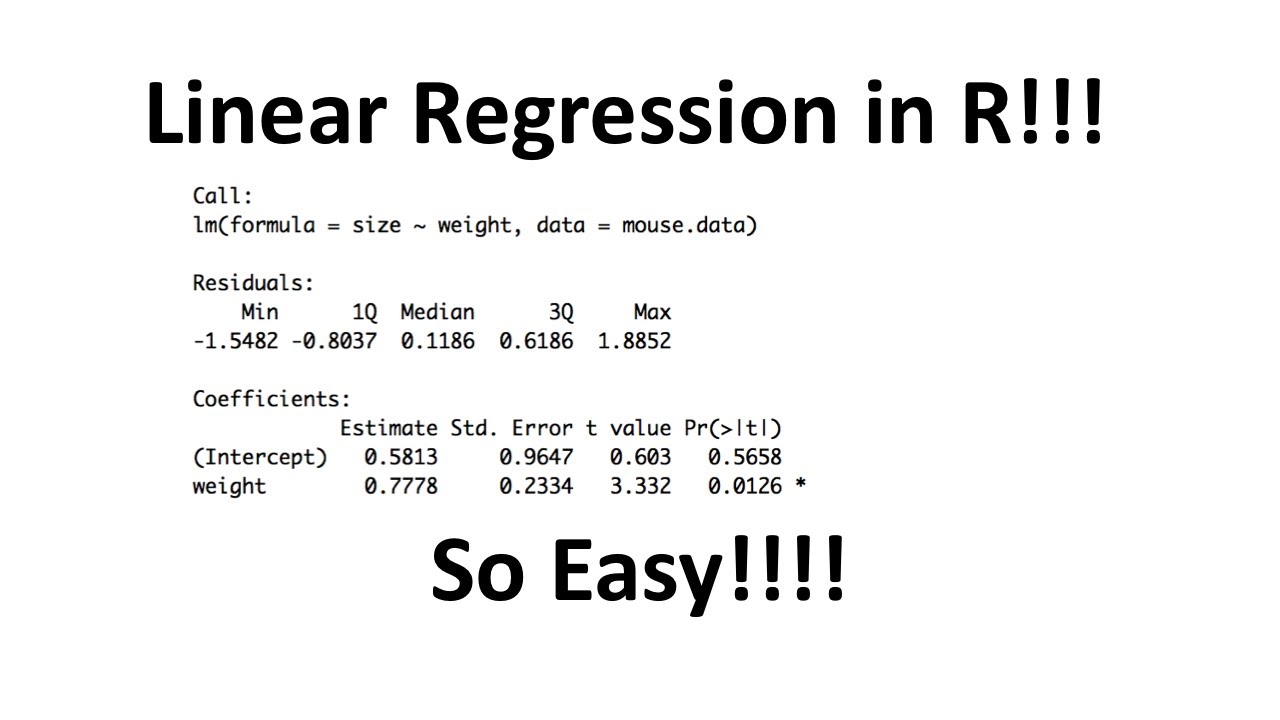
Linear Regression in R, Step-by-Step
5.0 / 5 (0 votes)
Thanks for rating: