HOW TO READ A COMPUTER OUTPUT FOR REGRESSION AP STATISTICS
TLDRThis video tutorial focuses on interpreting a linear regression computer output, a skill essential for the AP Statistics exam. It explains how to extract key information such as the slope and y-intercept from the coefficients table, and how to derive the regression equation using these values. The video also covers the calculation of the correlation coefficient (R) from the R-squared value and emphasizes the importance of R's sign matching the slope's sign. Lastly, it touches on the standard deviation of residuals, indicating the average distance of actual points from predicted ones.
Takeaways
- 📊 Linear Regression Analysis: The video discusses the process of interpreting a linear regression analysis output, specifically focusing on the relationship between volume and height.
- 🧠 Understanding the Equation: The key to understanding the output is recognizing that the equation provided (volume = -87.1 + 1.54 * height) indicates a relationship where the height is the independent variable (X) and volume is the dependent variable (Y).
- 🔍 Identifying Key Components: The first step in analyzing the output is to locate the slope (B value) and y-intercept (a value), which are found in the first column under 'Coefficients'.
- 📈 Slope and Y-Intercept: The slope of the regression line is 1.5433, representing the change in volume for each unit increase in height, while the y-intercept is -87.12, indicating the starting volume when height is zero.
- 📝 Writing the Predicted Line: To write the predicted line equation, use the y-intercept and slope values, resulting in the equation: ŷ (predicted volume) = -87.12 + 1.5433 * height.
- 🔑 Defining Variables: It's important to define the variables when presenting the equation, either by stating what ŷ and X represent or by incorporating the actual variable names like volume and height.
- 🔢 Finding the Correlation Coefficient (R): If R is not given, it can be found by taking the square root of the R-squared value, which in this case is 0.358, resulting in R = 0.598.
- 🌟 Positive or Negative R: The sign of R matches the sign of the slope, so if the slope is positive, R is positive, and vice versa. In this example, since the slope is positive, R is also positive.
- 📊 Interpreting R-Squared: R-squared, which is 35.8% in the example, represents the proportion of the variance in the dependent variable (volume) that is predictable from the independent variable (height).
- 📏 Standard Deviation of Residuals: The standard deviation of the residuals, 13.40 in this case, measures the average distance of the actual data points from the predicted values on the regression line.
Q & A
What is the main topic of the video?
-The main topic of the video is understanding and interpreting a linear regression computer output, particularly in the context of the AP Statistics exam.
What are the two variables involved in the regression analysis discussed in the video?
-The two variables involved in the regression analysis are height (X variable) and volume (Y variable).
How is the relationship between volume and height expressed in the video?
-The relationship is expressed as Volume = -87.1 + 1.54 * Height, indicating a linear regression model where volume is predicted based on the height.
What is the y-intercept in the given linear regression model?
-The y-intercept in the given linear regression model is -87.12.
What is the slope of the linear regression model discussed?
-The slope of the linear regression model is 1.5433.
How can you determine the predicted line from the given information?
-You can determine the predicted line by using the y-intercept and the slope. The equation is Predicted Volume (y-hat) = -87.12 + 1.5433 * Height.
What is R-squared and how is it related to the linear regression model?
-R-squared is a statistical measure that represents the proportion of the variance for a dependent variable that's explained by an independent variable or variables in the model. It is found by taking the square of the correlation coefficient (R).
How do you calculate R from R-squared if it's not provided in the output?
-To calculate R from R-squared, you convert R-squared from a percentage to a decimal and then take the square root of that value. For example, if R-squared is 35.8%, you would convert it to 0.358 and then take the square root to find R, which would be approximately 0.598.
How can you determine whether R is positive or negative?
-R always takes the same sign as the slope of the regression line. If the slope is positive, R will be positive; if the slope is negative, R will be negative.
What is the standard deviation of the residuals mentioned in the video?
-The standard deviation of the residuals is a measure of how far the actual data points are, on average, from the predicted points on the regression line. In the video, this value is given as 13.40.
What is the significance of the standard deviation of the residuals in the context of the regression analysis?
-The standard deviation of the residuals indicates the degree of spread or dispersion of the data points around the regression line. A smaller standard deviation suggests that the data points are closer to the line, indicating a better fit of the model to the data.
What is the adjusted R-squared mentioned in the video, and why is it not used in the AP Statistics course?
-Adjusted R-squared is a modified version of R-squared that adjusts for the number of predictors in the model. It is not used in the AP Statistics course because the focus is on the basic concepts of linear regression, and adjusted R-squared is considered a more advanced topic.
Outlines
📊 Linear Regression Analysis
This paragraph introduces the concept of linear regression analysis as it pertains to the AP exam. The speaker explains the importance of understanding how to interpret a computer output for a regression analysis, specifically between volume and height. The key elements to look for include the slope and y-intercept, which are found in the first column under coefficients. The speaker clarifies that the y-intercept is the constant value (-87.1 in this case) and the slope is the coefficient value (1.5433). The equation derived from the output is then explained, with the speaker emphasizing the need to define variables when writing the equation. The paragraph concludes with a brief mention of R-squared and its calculation, but notes that further details on this will not be covered in the first semester.
Mindmap
Keywords
💡Linear Regression
💡Computer Output
💡Slope
💡Y-Intercept
💡Coefficients
💡Predicted Line
💡R-Squared
💡Standard Deviation
💡Residuals
💡AP Exam
💡Volume and Height
Highlights
The video discusses the interpretation of a linear regression computer output, which is relevant for the AP exam.
The regression analysis is between volume and height, signifying that the X variable is height and Y variable is volume.
The equation derived from the regression is volume = -87.1 + 1.54 * height, indicating a relationship between the variables.
The slope (B value) of the regression line is 1.5433, which can be found in the first column under the coefficient section.
The y-intercept (a value) is -87.12, found under the constant in the coefficient section.
The predicted line equation is written using the y-intercept and slope, as volume = -87.12 + 1.5433 * height.
The video emphasizes the importance of defining variables when presenting the regression equation.
The R-squared value is given as 35.8%, which indicates the proportion of variance for the dependent variable that's explained by the independent variable(s).
To find R, one must take the square root of R-squared, converting the percentage to a decimal and then calculating the square root.
R is positive or negative depending on the slope of the regression line; in this case, since the slope is positive, R is also positive.
The standard deviation of the residuals is 13.14, representing the average distance of actual points from the predicted points.
The video provides a clear explanation of how to read and interpret a computer output for linear regression, which is crucial for AP Statistics students.
The process of identifying the slope and y-intercept from a computer output is detailed, aiding students in understanding how to derive the regression equation.
The significance of R and R-squared in determining the strength and direction of the relationship between variables is discussed.
The video clarifies which parts of the computer output are relevant for the AP exam and which can be ignored, helping students focus on the most important aspects.
The practical application of the video's content is highlighted by showing how to apply the regression equation to predict volume based on height.
The video's content is well-structured, making it easy for viewers to follow along and understand the key points of linear regression analysis.
Transcripts
Browse More Related Video
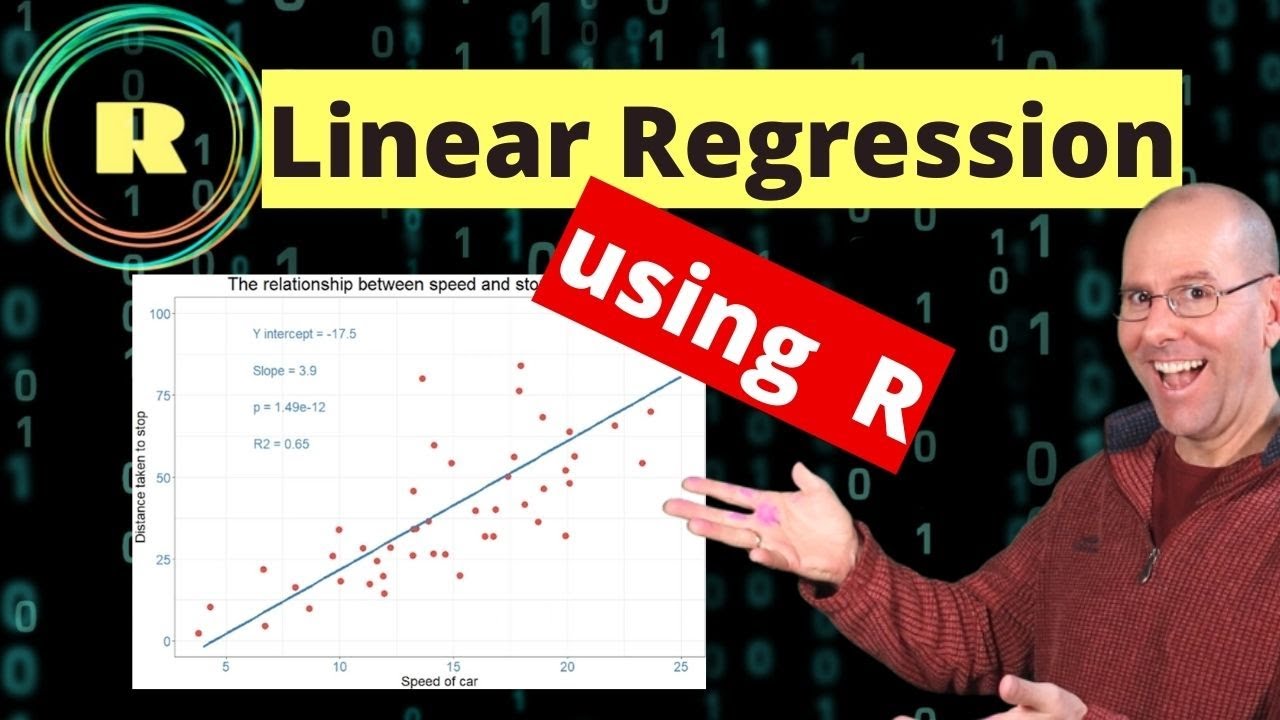
Linear regression using R programming

Regression and R-Squared (2.2)
Correlation and Coefficient of Determination in 3 Minutes

How to Calculate R Squared Using Regression Analysis
Simple Linear Regression in R | R Tutorial 5.1 | MarinStatsLectures

Top 10 Tips for AP Statistics Unit 2 Exploring Two Variable Data
5.0 / 5 (0 votes)
Thanks for rating: