The Main Ideas of Fitting a Line to Data (The Main Ideas of Least Squares and Linear Regression.)
TLDRThe video script introduces the concept of fitting a line to data, also known as linear regression or least squares. It explains the process of finding the optimal line that best fits a set of data points by minimizing the sum of squared residuals. The script uses a step-by-step approach, starting with a horizontal line at the average Y value and then rotating the line to find the 'sweet spot' where the sum of squared residuals is minimized. The optimal line is found by using the least squares method, which involves taking derivatives and setting them to zero to find the best slope (A) and Y-intercept (B). The final line is given as Y = 0.77 * X + 0.66, illustrating the practical application of the concept.
Takeaways
- 📈 The main topic is fitting a line to data, also known as least squares or linear regression.
- 🧬 The video is produced by the genetics department at the University of North, Carolina at Chapel Hill.
- 📊 A line is typically added to data points on a graph to identify trends and the best fit.
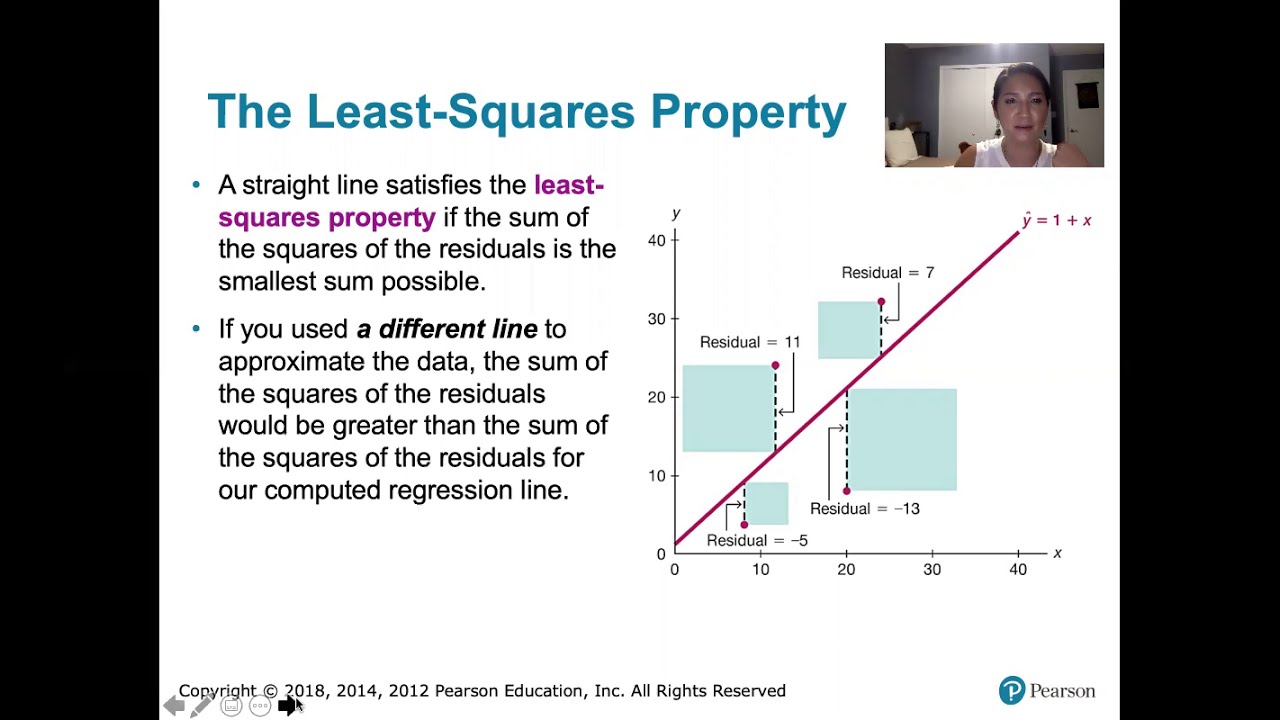
- 🎯 The optimal line fit is found by minimizing the sum of squared residuals between the data and the line.
- 🔍 The process starts with considering a horizontal line at the average Y value as a starting point.
- 📐 The distance between data points and the line is measured by the residuals, initially taken as absolute values but later squared to ensure positivity.
- 🌟 Squaring residuals helps in avoiding negative values that could falsely indicate a better fit.
- 🔢 The sum of squared residuals is used as a measure of how well the line fits the data points.
- 📉 Rotating the line can improve the fit, but there is a sweet spot to find the optimal angle that minimizes the sum of squared residuals.
- 🅿️ The line equation is Y = AX + B, where A is the slope and B is the Y-intercept.
- 🏆 The method of least squares is used to find the best values for A and B that minimize the sum of squared residuals.
- 💻 Derivatives are used to find the optimal slope and intercept where the sum of squared residuals is minimized, but this is typically done by computers, not by hand.
Q & A
What is the main topic of the StatQuest video?
-The main topic of the StatQuest video is fitting a line to data, also known as Least Squares or Linear Regression.【3】
Why do we usually add a line to our data in a graph?
-We add a line to our data in a graph to visualize the trend and better understand the relationship between the variables.【3】
What is the purpose of finding the optimal line to fit data points?
-The purpose of finding the optimal line is to minimize the sum of squared residuals, which improves the model's fit and predictive power.【3】
What is a residual in the context of fitting a line to data?
-A residual is the difference between the observed data point and the predicted value on the fitted line.【3】
Why do we square the residuals in the least squares method?
-We square the residuals to ensure that each term is positive, which allows us to sum them without cancellation and accurately measure the fit of the line.【3】
What does the sum of squared residuals represent?
-The sum of squared residuals represents the total distance between the observed data points and the fitted line, which is used to evaluate the quality of the fit.【3】
What are the components of the generic line equation mentioned in the video?
-The generic line equation is Y = A * X + B, where A is the slope of the line and B is the Y-intercept.【3】
How is the optimal rotation of the line for the best fit determined?
-The optimal rotation of the line is determined by minimizing the sum of squared residuals, which involves taking the derivative of the function and finding where it equals zero.【3】
What is the significance of the slope being zero at the best fit point?
-The slope being zero at the best fit point indicates that the sum of squared residuals is at its minimum, which means the line fits the data optimally at that point.【3】
How is the final line that minimizes the sum of squares defined in the video?
-The final line that minimizes the sum of squares is defined by the equation Y = 0.77 * X + 0.66.【3】
What is the main takeaway from the StatQuest video on fitting a line to data?
-The main takeaway is the understanding of the least squares method for finding the best fit line through data points, which involves minimizing the sum of squared residuals and applying concepts like slope, intercept, and derivatives.【3】
Outlines
📊 Introduction to Linear Regression
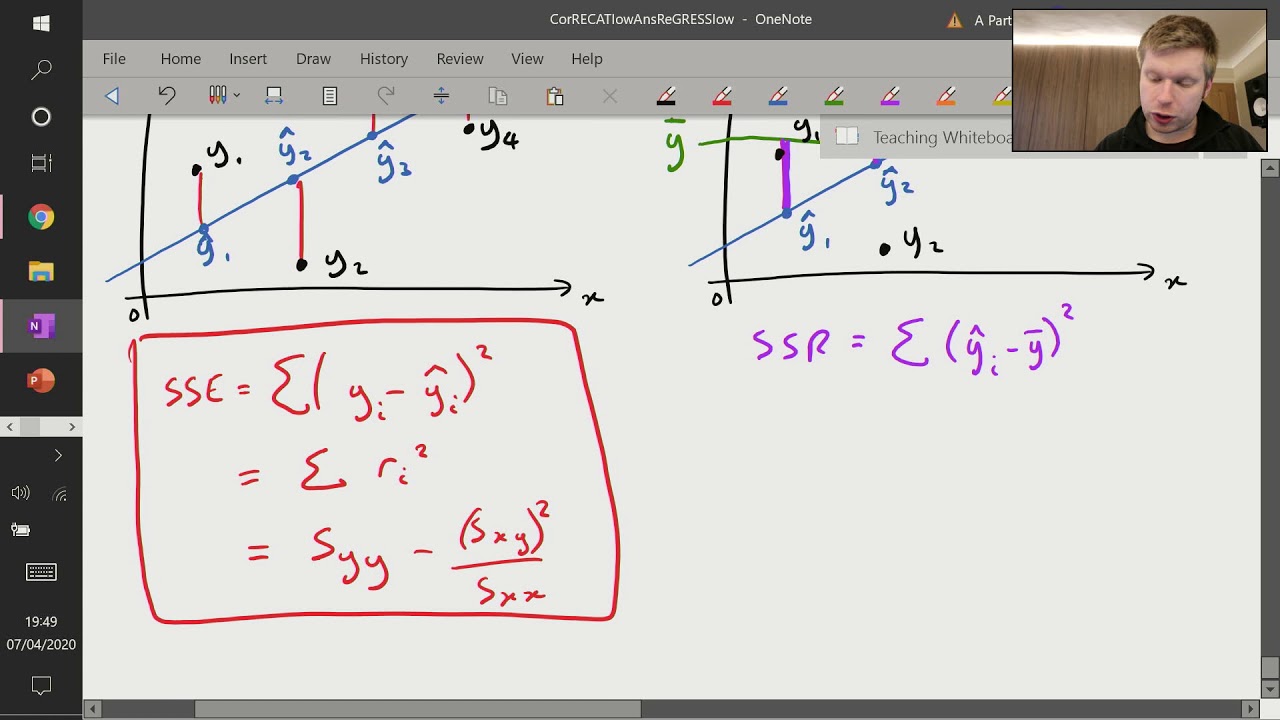
This paragraph introduces the concept of fitting a line to data, also known as linear regression or least squares. It begins by discussing the importance of identifying trends in data through the addition of a line on an XY graph. The video presents various lines that could potentially fit the data, questioning which line provides the best fit. It uses a horizontal line at the average Y value as a starting point, highlighting that this line represents the worst fit but serves as a foundation for discussion. The paragraph delves into how the fit of a line can be measured by the sum of the squared residuals, which are the differences between the actual data points and the line. It explains the process of rotating the line to find the optimal fit, resulting in the least sum of squared residuals, and introduces the generic line equation Y = AX + B, where A is the slope and B is the Y-intercept.
🔍 Optimal Line Fitting Through Least Squares
This paragraph continues the discussion on finding the optimal line that fits a set of data points. It explains the process of minimizing the sum of squared residuals to find the best values for the slope (A) and Y-intercept (B) of the line. The paragraph clarifies that the sum of squared residuals is the difference between the observed values and the values predicted by the line. It introduces the method of least squares for determining the best-fit line and presents a visual representation of how rotating the line affects the sum of squared residuals. The paragraph also touches on the mathematical process of taking derivatives to find the optimal rotation for the line, emphasizing that while this process is typically done on a computer, understanding the underlying concepts is crucial. It concludes with the presentation of the final line equation that minimizes the sum of squares, providing the best fit to the data.
Mindmap
Keywords
💡Least Squares
💡Linear Regression
💡Data Fit
💡Sum of Squared Residuals
💡Slope
💡Y-Intercept
💡Trend
💡Residuals
💡Derivative
💡3D Graph
💡Optimal Line
Highlights
StatQuest is brought to you by the friendly folks in the genetics Department at the University of North, Carolina at Chapel Hill.
Today's topic is fitting a line to data, also known as Least Squares or Linear Regression.
A horizontal line through the average Y value of data is a good starting point for discussing optimal data fit.
The distance between data points and the line is measured by the sum of squared residuals.
Squaring each term in the sum of squared residuals ensures that all terms are positive, simplifying calculations.
Rotating the line can improve the fit, as evidenced by a decrease in the sum of squared residuals.
The optimal line fit is found by minimizing the sum of squared residuals, which is the basis of the Least Squares method.
The general line equation is Y = AX + B, where A is the slope and B is the Y-intercept.
The process of finding the best values for A and B involves taking the derivative of the sum of squared residuals function and finding where it equals zero.
A 3D graph can illustrate how different values for slope (A) and intercept (B) affect the sum of squared residuals.
The final line of best fit is defined by the equation Y = 0.77 * X + 0.66.
Least Squares is a method used to find the line that minimizes the sum of squares between the observed data and the line.
The concept of minimizing the square of the distance between observed values and the line is crucial for fitting a line to data.
Understanding the process of finding the optimal line fit involves grasping the concepts of derivatives and their applications in this context.
The practical application of this method is essential for various fields, including genetics and data analysis.
The discussion on fitting a line to data is an important statistical concept that helps in identifying trends and making predictions.
This StatQuest episode provides a comprehensive overview of the Least Squares method and its significance in data analysis.
Transcripts
Browse More Related Video
10.2.5 Regression - Residuals and the Least-Squares Property

Introduction To Ordinary Least Squares With Examples

Calculus Chapter 2 Lecture 14 BONUS

Lec 9: Max-min problems; least squares | MIT 18.02 Multivariable Calculus, Fall 2007
Correlation and Regression (6 of 9: Sum of Squares - SSE, SSR and SST)

Least squares | MIT 18.02SC Multivariable Calculus, Fall 2010
5.0 / 5 (0 votes)
Thanks for rating: