Limits from graphs | Limits and continuity | AP Calculus AB | Khan Academy
TLDRThe video script discusses the concept of limits in calculus, using graphs of functions to illustrate how limits are determined. It explains that for a limit to exist, the function values must approach the same limit from both the left and right as x approaches a certain value. The script provides several examples, showing how limits can exist even if the function is not defined at a point, and how a limit can fail to exist if the function approaches different values from opposite sides. The importance of precision and the limitations of graphical estimation are also highlighted.
Takeaways
- 📈 The concept of limits in calculus is introduced through the examination of the function f(x).
- 🎯 Limits are evaluated by considering the behavior of the function as x approaches specific values.
- 🠔 For the limit at x=6, the function f(x) appears to approach the value of 1 from both the left and right, suggesting the limit exists.
- 🔢 Even if a function is not defined at a certain point, a limit can still exist, as demonstrated at x=4 where the limit is 3 despite the function being undefined at that point.
- 🌀 At x=2, the function f(x) approaches different values from the left (2) and right (closer to 5), indicating the limit does not exist.
- 📊 The graphical representation of limits provides an estimation but not an exact value, as seen with the limit of g(x) at x=5, which is roughly 0.4.
- 🔄 The process of evaluating limits involves examining the function's behavior from both the left and right to ensure consistency.
- 🚫 If a function approaches unbounded values as x approaches a certain point, the limit is considered to not exist.
- 📈 The script presents a method for visually assessing limits through the analysis of the function's graph.
- 📚 Understanding the existence or non-existence of limits is crucial for comprehending the behavior of functions in calculus.
Q & A
What is the limit of f(x) as x approaches 6?
-The limit of f(x) as x approaches 6 is 1, as the function appears to approach the same value from both the left and right sides.
Is the function f(x) defined at x equals 6?
-Yes, the function f(x) is defined at x equals 6, and the limit at this point is equal to the value of the function itself.
What happens when we consider the limit of f(x) as x approaches 4?
-The limit of f(x) as x approaches 4 exists and is equal to 3, even though the function is not defined at x equals 4.
How does the value of f(x) behave as x approaches 2 from the left and right?
-As x approaches 2 from the left, f(x) approaches 2, but from the right, it gets closer to 5. Since the function is approaching two different values from each side, the limit does not exist.
What can we infer about the limit from the graph of a function?
-From the graph of a function, we can infer an estimate of the limit by observing the behavior of the function as it approaches a certain value. However, the graph only provides an approximation and not an exact value.
What is the limit of g(x) as x approaches 5?
-The limit of g(x) as x approaches 5 is approximately 0.4, based on the visual estimation from the graph.
Is the value of g(x) at x equals 7 the same as the limit as x approaches 7?
-No, the value of g(x) at x equals 7 is five, but the limit as x approaches 7 exists and is equal to two, which is different from the function's value at that point.
What does it mean for a limit to not exist?
-A limit does not exist if the function is approaching different values as it approaches a certain point from the left and right sides, or if the function is unbounded and going towards infinity.
How does the function g(x) behave as x approaches 1?
-As x approaches 1, g(x) goes unbounded towards infinity, which means the limit does not exist in this case.
What is the importance of understanding limits in calculus?
-Understanding limits is crucial in calculus as they are fundamental to understanding the behavior of functions, particularly at points of discontinuity, and are essential in calculating derivatives and integrals.
How can one determine if a limit exists without a graph?
-One can determine if a limit exists by using algebraic methods, such as direct substitution, factoring, or applying limit laws, which can provide a precise value or show that the limit does not exist.
Outlines
📊 Analyzing Graphical Limits - Part 1
This paragraph introduces the concept of graphical limits in the context of a function represented by the graph of y = f(x). The instructor begins by posing a question about the limit as x approaches 6, encouraging viewers to attempt to solve it before moving forward. The analysis involves observing the graph to determine the behavior of f(x) as x gets closer to 6 from both the left and right sides. The conclusion is that the limit appears to be 1, as the function values approach the same value from both directions. The discussion then shifts to the limit as x approaches 4, noting that even though the function is not defined at x = 4, the limit can still be determined from the graph. In this case, the limit is found to be 3, as the function values approach the same value from both the left and right sides of x = 4. The third limit considered is as x approaches 2. Here, the function is defined at x = 2, but the limit does not exist because the function values approach different values from the left and right sides. This example illustrates that a function can be defined at a point but still not have a limit as x approaches that point. The paragraph concludes with a brief mention of looking at more cases to understand graphical limits, setting up the stage for further analysis in subsequent paragraphs.
📈 Graphical Limits Continued - Part 2
This paragraph continues the exploration of graphical limits with a focus on the function g(x). The first limit examined is as x approaches 5. The instructor guides the viewer to observe the graph and estimate the limit by drawing a straight line to represent the function's behavior as it nears the value of x = 5. The visual estimation suggests a limit of approximately 0.4, although the exact value cannot be determined without further calculation. The second limit discussed is as x approaches 7. The analysis involves observing the function's behavior from values less than 7, such as 6.9, 6.99, and 6.999. The function appears to approach the value of 2 from both the left and right sides of x = 7. However, it is noted that even though the function is defined at x = 7, the limit value is different from the function's value at that point. The final limit considered in this paragraph is as x approaches 1. The graph indicates that the function is unbounded as it approaches this value, with function values moving towards infinity from both the left and right sides. The instructor emphasizes the importance of being formal in the context of limits, stating that the limit does not exist because the function is unbounded at this point. The paragraph ends with a summary of the key points discussed, reinforcing the concept that a function can be defined at a point but not have a limit, and that limits can exist even if the function is not defined at a particular x-value.
Mindmap
Keywords
💡Limit
💡Graphical limits
💡Approaching from the left/right
💡Undefined function
💡Function behavior
💡Unbounded
💡Continuity
💡Existence of limit
💡Graph of Y equals f(x)
💡Does not exist (DNE)
Highlights
The concept of limits in functions is introduced with a focus on understanding the behavior of a function as the input approaches a certain value.
The importance of approaching a value from both the left and right sides is emphasized for the existence of a limit.
A limit can exist even if the function is not defined at a particular point, as demonstrated when approaching x equals four.
The limit at x equals six exists and is equal to the value of the function at that point, which is one.
The graphical representation of limits provides an estimate, but not an exact value, as seen with the limit approaching x equals four being three.
The function is defined at x equals two, but the limit does not exist due to different approaches from the left and right sides.
The limit as x approaches two from the left is approaching the value of two, while from the right, it approaches five, showing inconsistency.
The graph of Y equals g of x is presented for further analysis of limits.
The limit as x approaches five for g of x is approximately 0.4, demonstrating the use of graphical estimation.
The limit as x approaches seven for g of x is two, even though the function is defined with a different value at x equals seven.
The function g of x at x equals seven has a defined value, but the limit as x approaches seven is different, highlighting the distinction between the two concepts.
The limit as x approaches one for g of x does not exist because the function is unbounded and approaches infinity from both sides.
The concept of a limit not existing due to an unbounded function is discussed, emphasizing the formal definition of a limit.
The session concludes with the understanding that limits can provide valuable insights into the behavior of functions, even when not defined at certain points.
The use of graphical analysis to estimate limits is a practical tool for understanding the behavior of functions without exact calculations.
The transcript provides a comprehensive overview of the concept of limits, including their existence, non-existence, and the conditions under which they hold.
Transcripts
Browse More Related Video
BusCalc 02 Limits and Continuity
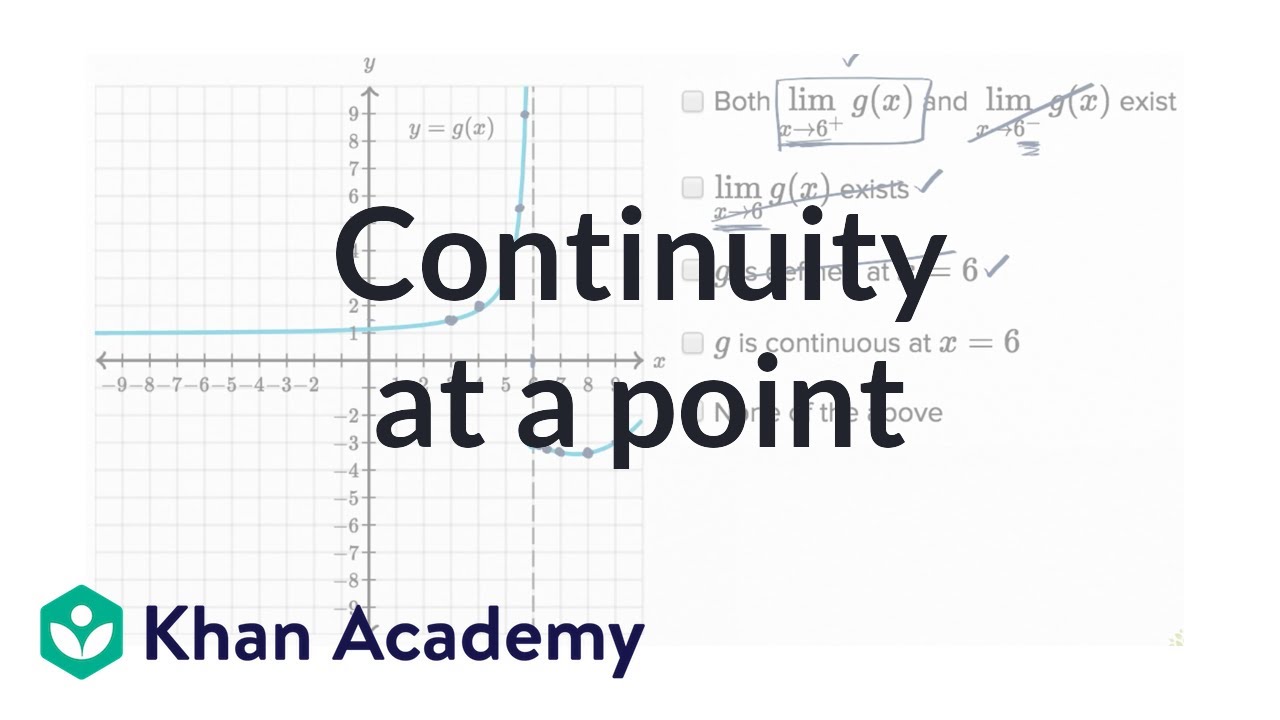
Worked example: Continuity at a point | Limits and continuity | AP Calculus AB | Khan Academy

Math 11 - Sections 1.1-1.2
Business Calculus - Math 1329 - Section 1.5 (Part 1) - Limits and Continuity
How To Evaluate Limits From a Graph
A Tale of Three Functions | Intro to Limits Part II
5.0 / 5 (0 votes)
Thanks for rating: