How To Evaluate Limits From a Graph
TLDRThe video script discusses the concept of limits in calculus, explaining how to determine the value of a limit from a graph. It uses various examples to illustrate one-sided limits, limits from both sides, and the value of a function at a specific point. The script also covers cases where limits do not exist due to non-matching values from different approaches or undefined functions. Additionally, it explains how to evaluate limits at infinity by identifying horizontal and vertical asymptotes.
Takeaways
- 📌 Limits can be read from graphs by observing the behavior of the function as x approaches certain values.
- 🔍 One-sided limits are determined by the y-values as x approaches a point from the left or right side.
- 🔄 If the y-values from the left and right approaches to a point do not match, the limit does not exist.
- 🎯 For one-sided limits, look at open circles on the graph to determine the behavior of the function.
- 💠 When x equals a certain value, look for closed circles on the graph to find the function's value at that point.
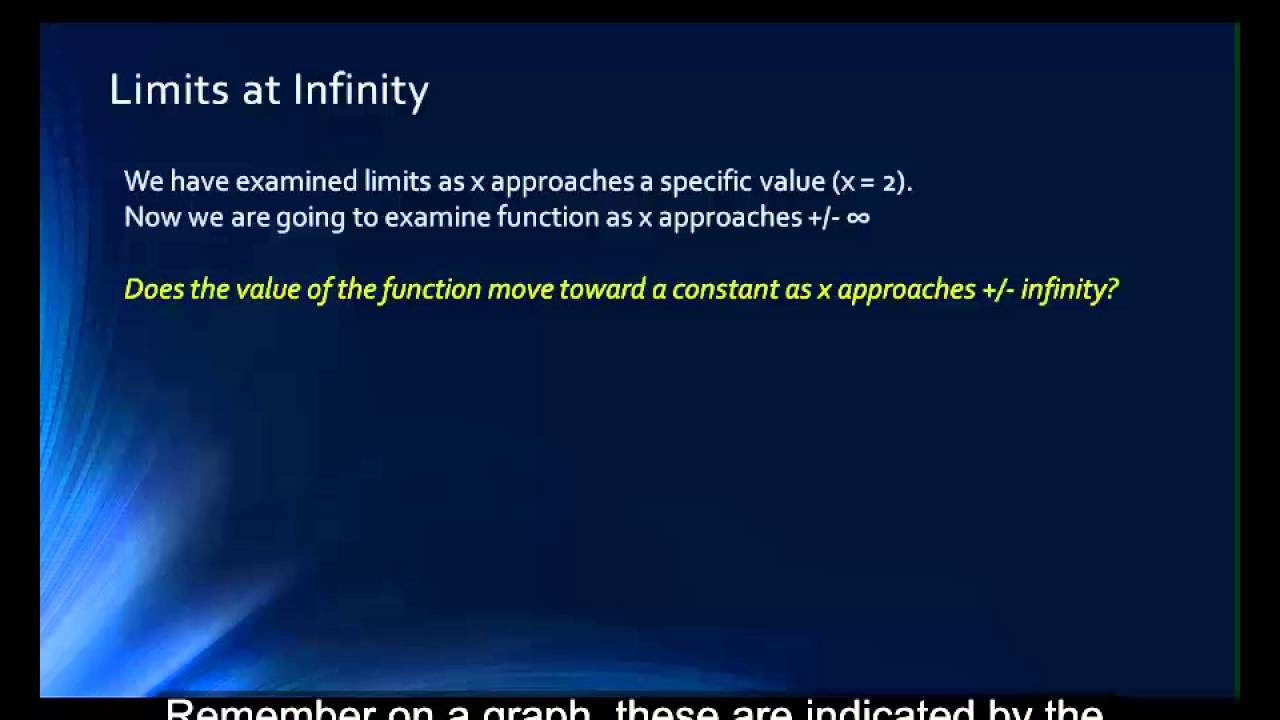
- 🌐 For limits as x approaches infinity or negative infinity, examine the horizontal asymptotes of the graph.
- 📈 If the y-value approaches a horizontal asymptote, the limit at positive or negative infinity is the y-value of that asymptote.
- 🔢 Infinity is not a number but a representation of a value that keeps increasing without bound.
- 🚫 If there is no closed circle at a certain x-value, the function is not defined at that point.
- 🤔 In cases of vertical asymptotes, the function approaches positive or negative infinity as x gets closer to the asymptote.
- 📊 Horizontal asymptotes can be used to evaluate limits at infinity, indicating the y-value the function approaches as x becomes very large.
Q & A
How do you determine the value of a limit from a graph?
-To determine the value of a limit from a graph, you analyze the behavior of the function's graph as it approaches a particular point. This involves looking at open circles (which indicate the function does not have a defined value at that point) and closed circles (indicating the function has a defined value at that point) and observing the y-values as x approaches a certain value from the left, right, or both sides.
What is a one-sided limit?
-A one-sided limit refers to the value of the function as x approaches a certain point from either the left or the right side, but not both. It is used when the function's behavior near a point differs depending on the direction from which the point is approached.
What does the absence of a closed circle at a point on the graph indicate?
-The absence of a closed circle at a point on the graph indicates that the function is not defined at that point, meaning the function does not have a specific y-value when x equals that particular value.
How can you find the limit as x approaches a value from the left side?
-To find the limit as x approaches a value from the left side, you observe the y-values of the function's graph as it gets closer to the given x-value from the left. The limit is the value the function approaches, just before reaching the x-value.
What does it mean when the limit exists as x approaches a certain value from both sides?
-When the limit exists as x approaches a certain value from both sides, it means that the function's behavior is consistent from both directions as it approaches that x-value. The left-sided and right-sided limits are equal, and they represent the actual limit of the function at that point.
What is the significance of a vertical asymptote in the context of limits?
-A vertical asymptote is a line that the graph of the function approaches but never actually intersects or crosses. In the context of limits, it indicates that the function's y-values tend towards infinity or negative infinity as x gets closer to a certain value from either side.
How do you evaluate limits at infinity?
-Limits at infinity are evaluated by observing the behavior of the function's graph as x becomes very large (positive infinity) or very small (negative infinity). If the graph approaches a horizontal asymptote, the limit is the y-value of that asymptote. If the graph does not converge to a horizontal asymptote, it may tend towards infinity or negative infinity.
What is the difference between a limit that exists and a limit that does not exist?
-A limit exists when the function's behavior is consistent and predictable as x approaches a certain value, resulting in a well-defined y-value. A limit does not exist when the function's behavior is not consistent or predictable, such as when the left-sided and right-sided limits differ, or when the function approaches infinity or negative infinity.
How can you determine the value of f(x) at a specific x-value based on the graph?
-To determine the value of f(x) at a specific x-value based on the graph, you look for a closed circle at that x-value. If a closed circle is present, the y-value at that point is the value of the function at that x-value. If no closed circle is present, the function is not defined at that x-value, and thus f(x) does not exist there.
What is the role of horizontal asymptotes in evaluating limits?
-Horizontal asymptotes play a crucial role in evaluating limits when x approaches very large or very small values (infinity or negative infinity). They provide a reference line that the function's graph approaches but never reaches. The y-value of the horizontal asymptote indicates the limit of the function as x tends towards infinity or negative infinity.
How do you interpret a limit that approaches infinity or negative infinity?
-A limit that approaches infinity or negative infinity indicates that the function's y-values become very large without bound as x approaches a certain value. While infinity is not a specific number, it serves as a descriptive term for the behavior of the function as it grows larger or smaller without limit.
Outlines
📊 Understanding One-Sided and Two-Sided Limits from Graphs
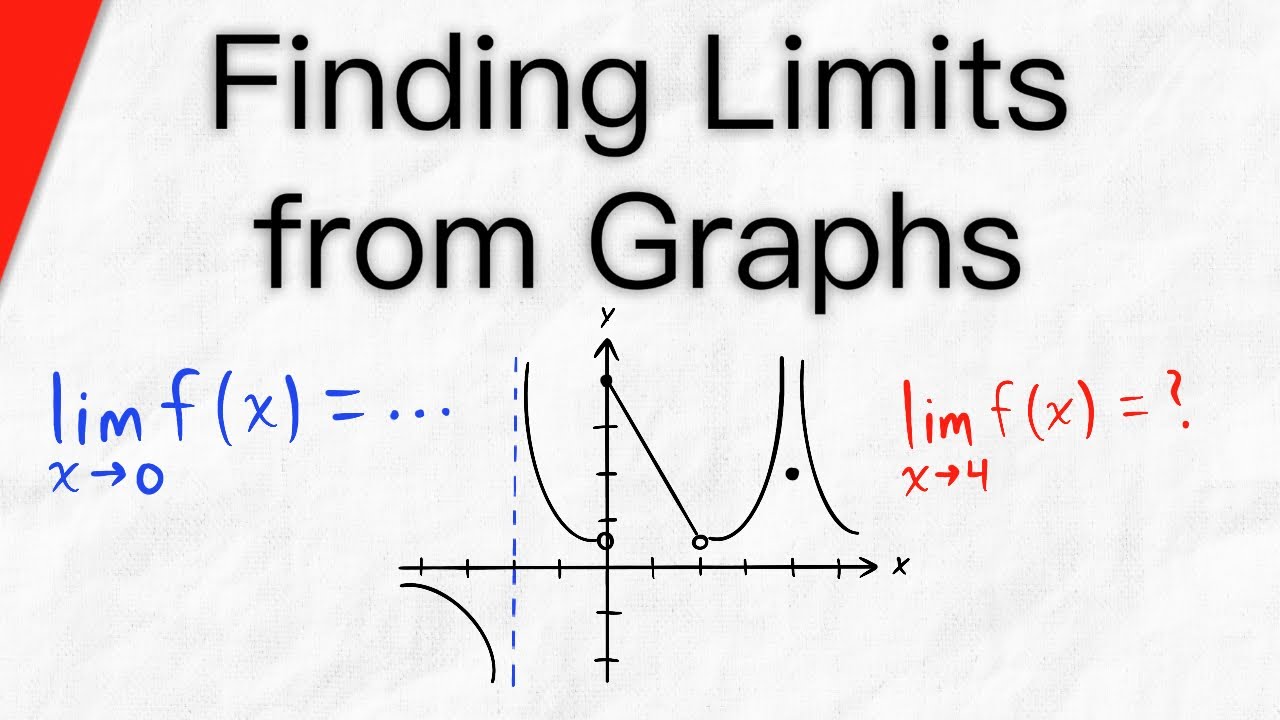
This paragraph discusses the method of determining the value of a limit from a graph. It explains the concept of one-sided limits by using an example of a function f(x) with points represented by open and closed circles. The limit as x approaches 2 from the left side is found to be 3, while from the right side it is -4. The two-sided limit does not exist due to the mismatch of the y-values. Additionally, the value of f(2) is determined to be 1 by examining the closed circle at the x=2 point. Another example is provided where the limit as x approaches 3 from either side is found to be 2, as the y-values are consistent. The paragraph emphasizes the importance of looking for closed circles to determine the function value at a specific x.
🌐 Evaluating Limits at Infinity and Asymptotes
This paragraph delves into the evaluation of limits as x approaches positive and negative infinity, as well as dealing with vertical and horizontal asymptotes. It begins with an example of finding limits as x approaches 4 from both the left and right sides. The limit from both sides is determined to be negative two since the y-values are the same. The function is continuous at x=4. The paragraph then explores the concept of negative infinity and positive infinity, explaining that these represent the direction of无限大 (infinity) rather than a specific value. It also discusses the undefined nature of limits when no closed circle is present on the graph, such as at x=3. The concept of horizontal asymptotes is introduced, with examples of limits at positive infinity and negative infinity based on the y-values of the horizontal asymptotes.
Mindmap
Keywords
💡Limit
💡One-sided limit
💡Closed circle
💡Open circle
💡Y-value
💡X-value
💡Graph
💡Asymptote
💡Infinity
💡Continuous function
💡Discontinuity
Highlights
The concept of one-sided limits is introduced, which is the limit as x approaches a certain value from either the left or the right side.
The importance of identifying the correct type of circle (open or closed) when determining the value of a function at a specific point is emphasized.
The method of determining the limit as x approaches a value from the left side is explained, using the example of x approaching 2 and the corresponding y value being 3.
The process of finding the limit as x approaches a value from the right side is described, illustrated with x approaching 2 and the y value being -4.
The concept of a limit not existing when the left and right one-sided limits do not match is clarified.
The method for finding the value of a function when x is exactly at a certain value is demonstrated, with the example of f(2) = 1 when there is a closed circle present.
The approach to solving problems involving limits is outlined, emphasizing the need to consider both left and right approaches and the value at x itself.
A new example is presented to practice finding limits from both the left and right sides, and the value of the function at x=2, highlighting the absence of a closed circle in this case.
The concept of limits as x approaches positive or negative infinity is introduced, with the explanation of horizontal asymptotes.
The method for evaluating limits at infinity by finding the corresponding horizontal asymptote is detailed.
The concept of vertical asymptotes and their role in determining limits as y approaches infinity is explained.
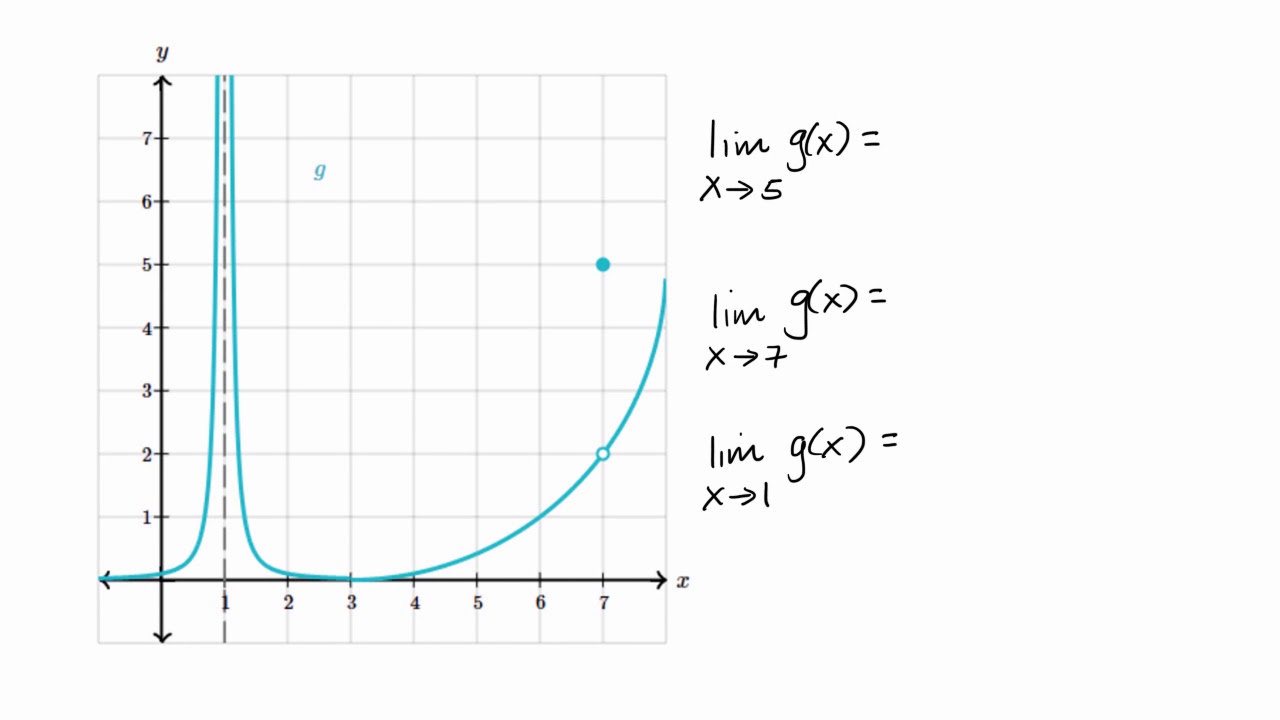
An example is provided to illustrate the process of finding the limit as x approaches a certain value from the left, involving a curve approaching a horizontal asymptote.
The process of finding the limit as x approaches a value from the right is demonstrated, with the curve approaching a vertical asymptote.
The concept of a limit not existing when the approaches from the left and right yield different results is clarified, using the example of x approaching 3.
The function's continuity at x=4 is explained, with both left and right one-sided limits being equal and the same as the function's value at that point.
The concept of negative infinity as a limit is introduced, explaining that it is not a real number but a description of a behavior as x approaches a certain value.
The method for evaluating limits involving horizontal asymptotes is demonstrated, using the example of x approaching positive infinity with a y value of 3.
Transcripts
Browse More Related Video
Find Limits from Graphs | Calculus 1

Introduction to Limits (NancyPi)
Business Calculus - Math 1329 - Section 1.5 (Part 1) - Limits and Continuity

BusCalc 03 Estimating Limits from Tables
Limits from graphs | Limits and continuity | AP Calculus AB | Khan Academy
Math 1325 Lecture 9 2 - Continuous Functions & Limits at Infinity
5.0 / 5 (0 votes)
Thanks for rating: