Choosing a Statistical Test for Your IB Biology IA
TLDRThis video script offers a comprehensive guide for IB Biology students on selecting the appropriate statistical test for their internal assessments. It emphasizes the importance of understanding two key aspects: the purpose of the research, which can be either comparison or relationship, and the type of data, categorized as categorical or continuous. The script then outlines three main families of statistical tests: chi-squared, t-test or ANOVA, and correlation, each suitable for different scenarios. It further breaks down the types of t-tests and ANOVA based on the number of groups in the experiment and introduces Pearson's correlation and regression for analyzing relationships between variables. The video also cautions about the assumption of normal distribution in data and mentions nonparametric alternatives for tests. Aimed at high school students, the script simplifies complex statistical concepts, making them accessible for those new to the subject.
Takeaways
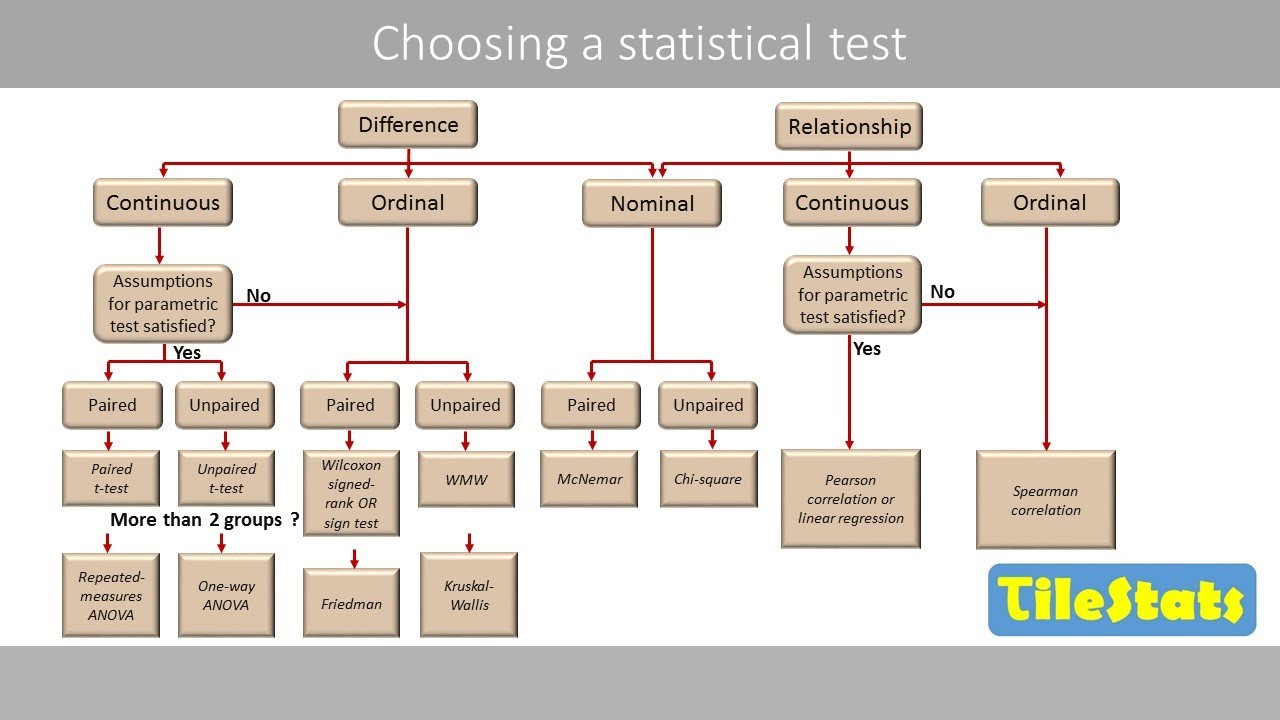
- 🔍 **Purpose of Research**: The first step in choosing a statistical test is to determine the purpose of your research question, which can be either comparison or relationship.
- 👥 **Comparison vs. Relationship**: In comparison, you look for differences between groups, while in relationships you seek connections or predictions between variables.
- ⚖️ **Types of Data**: Data can be categorized as categorical (qualitative) or continuous (quantitative), which influences the choice of statistical test.
- 📊 **Chi-Squared Family**: Used for tests with categorical data when the purpose is comparison, such as testing for differences between groups.
- 📉 **T-Test Family**: Applies when comparing means of different groups with either categorical or continuous data.
- 🔬 **ANOVA Test**: Utilized for comparison purposes when there are three or more groups, to see if they are statistically similar or different.
- 🤝 **Paired T-Test**: Appropriate for comparing the same group tested twice, looking for differences within paired data points.
- 🔗 **Correlation Family**: Involves tests like Pearson's correlation to measure the strength of the relationship between two continuous variables.
- 📐 **Regression Analysis**: Seeks to find a mathematical equation that describes the relationship between variables for predictive purposes.
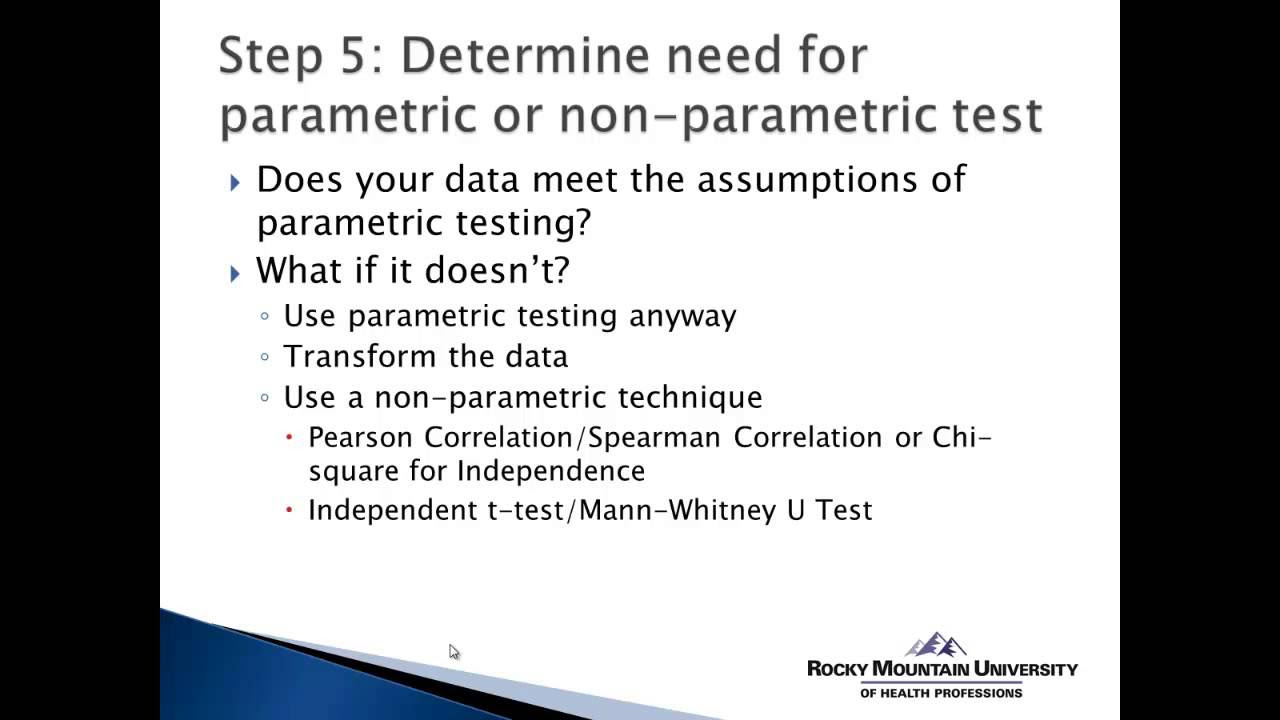
- ⚠️ **Assumptions of Tests**: Many statistical tests assume a normal distribution of data; violating these assumptions can lead to unreliable results.
- 🔄 **Nonparametric Alternatives**: If the normal distribution assumption is not met, nonparametric alternatives exist for many tests.
- 📚 **Target Audience**: The video is aimed at IB biology students, simplifying complex statistical concepts for those new to the subject.
Q & A
What are the two main features to consider when choosing a statistical test for an IB biology internal assessment?
-The two main features to consider are the purpose of your research question and the type of data you are looking at. Purpose can be either comparison or relationship, while data type can be categorical or continuous.
What is the primary goal of a comparison in statistical terms?
-The primary goal of a comparison in statistical terms is to understand whether there's a difference between groups, such as males versus females, control groups versus treatment groups, or individuals grouped by a certain characteristic.
What does it mean to find a relationship in statistical analysis?
-Finding a relationship in statistical analysis means looking for a connection or correlation between two variables. It involves seeking out causation or prediction from one variable to another, such as the relationship between height and flexibility or age and muscle mass.
What are categorical data in statistics?
-Categorical data in statistics are qualitative and even if they include numbers, those values do not represent any numerical meaning. Examples include political party affiliation, yes-or-no answers, or the identification of a gene that was expressed.
What is continuous data and how does it differ from categorical data?
-Continuous data is quantitative or numerical, representing an increasing amount of a property as the value increases. It differs from categorical data in that it involves measurable quantities, such as heart rate, age, or the number of bacterial colonies.
Name the three main families of statistical tests and what they are used for.
-The three main families of statistical tests are the chi-squared family (used for categorical data in comparisons), the t-test or ANOVA family (used for comparisons involving both categorical and continuous data), and the correlation family (used for finding relationships between continuous variables).
What type of statistical test is appropriate for comparing the mean height of a high school to the US population average for teenagers?
-A one sample t-test is appropriate for comparing the mean height of a high school to the US population average for teenagers, as it involves comparing one sample group to a known population average.
How does a two sample unpaired t-test differ from a two sample paired t-test?
-A two sample unpaired t-test is used when comparing the mean height of two different groups, such as men and women. In contrast, a two sample paired t-test is used when the same group is tested twice under different conditions, such as before and after an exercise, to find out if there's a difference due to the intervention.
What is the purpose of a one-way ANOVA test?
-A one-way ANOVA test is used to determine whether three or more groups have similar means or if at least one group is statistically different from the others. However, it does not specify which group is different or if there are multiple groups that are statistically different from each other.
What are the two primary tests used when there is one independent variable and one dependent variable in a statistical analysis?
-The two primary tests used in this scenario are Pearson's correlation, which determines how closely connected two variables are, and regression, which aims to find a specific mathematical equation describing the relationship between the variables.
Why is it important to consider the assumptions of a statistical test before using it?
-It is important to consider the assumptions of a statistical test because if the assumptions, such as normal distribution of data, are not met, the results of the test will not be reliable and could lead to incorrect conclusions.
What are nonparametric alternatives and why are they useful in statistical analysis?
-Nonparametric alternatives are counterparts to traditional statistical tests that do not rely on the same assumptions, such as normal distribution. They are useful when the data does not meet the assumptions required for parametric tests, allowing for more flexibility and reliability in the analysis.
Outlines
📊 Choosing a Statistical Test for IB Biology Research
This paragraph introduces the topic of selecting an appropriate statistical test for an IB Biology internal assessment. It emphasizes the importance of understanding the purpose of the research question and the type of data being analyzed. The purpose can be either comparison, where the goal is to find differences between groups, or relationship, where the aim is to find connections or predict outcomes based on one variable to another. Data types are categorized into categorical (qualitative) and continuous (quantitative). Based on the purpose and data type, one can choose from three main families of statistical tests: chi-squared, t-test/ANOVA, and correlation. The paragraph outlines the characteristics of each family and provides examples of when to use specific tests within those families.
🔍 Deep Dive into Statistical Test Families
The second paragraph delves deeper into the specifics of each statistical test family. It explains that for experiments involving comparison with categorical data, the chi-squared test is appropriate. When comparing means with both categorical and continuous data, the t-test family is used, which includes one-sample, two-sample unpaired, and two-sample paired t-tests, depending on the number of groups and whether the same group is tested twice. For experiments with more than two groups, a one-way ANOVA test is suggested to determine if all groups are similar or if there's a significant difference among them. The paragraph also introduces the correlation family, which includes Pearson's correlation and regression analysis for examining relationships between continuous variables. It highlights the assumption of normal distribution for many tests and mentions nonparametric alternatives for cases where these assumptions are not met. The video is aimed at IB Biology students, noting that it provides simplifications and does not cover all statistical classifications and tests.
Mindmap
Keywords
💡Statistical test
💡Purpose of research
💡Categorical data
💡Continuous data
💡Chi-squared family
💡t-test
💡ANOVA
💡Correlation
💡Regression
💡Normal distribution
💡Nonparametric test
Highlights
Choosing a statistical test for IB Biology internal assessment involves considering two main features of the experiment: its purpose and the type of data involved.
There are two major purposes for research questions: comparison and relationship, which respectively aim to understand differences between groups and connections between variables.
Examples of comparison include males versus females, control groups versus treatment groups, and grouping individuals by color preference.
Relationship analysis might involve looking for a correlation between height and flexibility or whether age predicts muscle mass.
Data types are categorized into categorical (qualitative) and continuous (quantitative), which influences the choice of statistical test.
Categorical data includes political party affiliation or yes-or-no answers, while continuous data involves measurements like heart rate or age.
Three main families of statistical tests are chi-squared, t-test/ANOVA, and correlation, each suited for different experimental purposes and data types.
Chi-squared tests are used for categorical data when the experiment aims to draw a comparison or find a difference.
T-test family is appropriate for experiments with a categorical independent variable and continuous dependent variable.
A one-sample t-test is used when comparing the mean of a single sample group to a known population average.
A two-sample unpaired t-test is for comparing the mean height of two different groups, such as men and women.
A paired t-test is used when the same group is tested twice under different conditions, like before and after an exercise.
One-way ANOVA is employed for experiments with more than two groups to see if they are similar or if one is statistically different.
Pearson's correlation and regression are used when there's one independent and one dependent variable to understand the strength of their relationship or to predict outcomes.
Many statistical tests assume a normal distribution of data; nonparametric alternatives exist for when these assumptions are not met.
The video provides a simplified overview aimed at high school IB Biology students who may not have prior statistics experience.
Further videos will cover how to perform the statistical tests and calculations relevant to IB Biology students.
Transcripts
Browse More Related Video

Choosing a Statistical Test
How to choose an appropriate statistical test

Statistics made easy ! ! ! Learn about the t-test, the chi square test, the p value and more

Quantitative Data Analysis 101 Tutorial: Descriptive vs Inferential Statistics (With Examples)
How to Use SPSS: Choosing the Appropriate Statistical Test
Statistical Tests: Choosing which statistical test to use
5.0 / 5 (0 votes)
Thanks for rating: