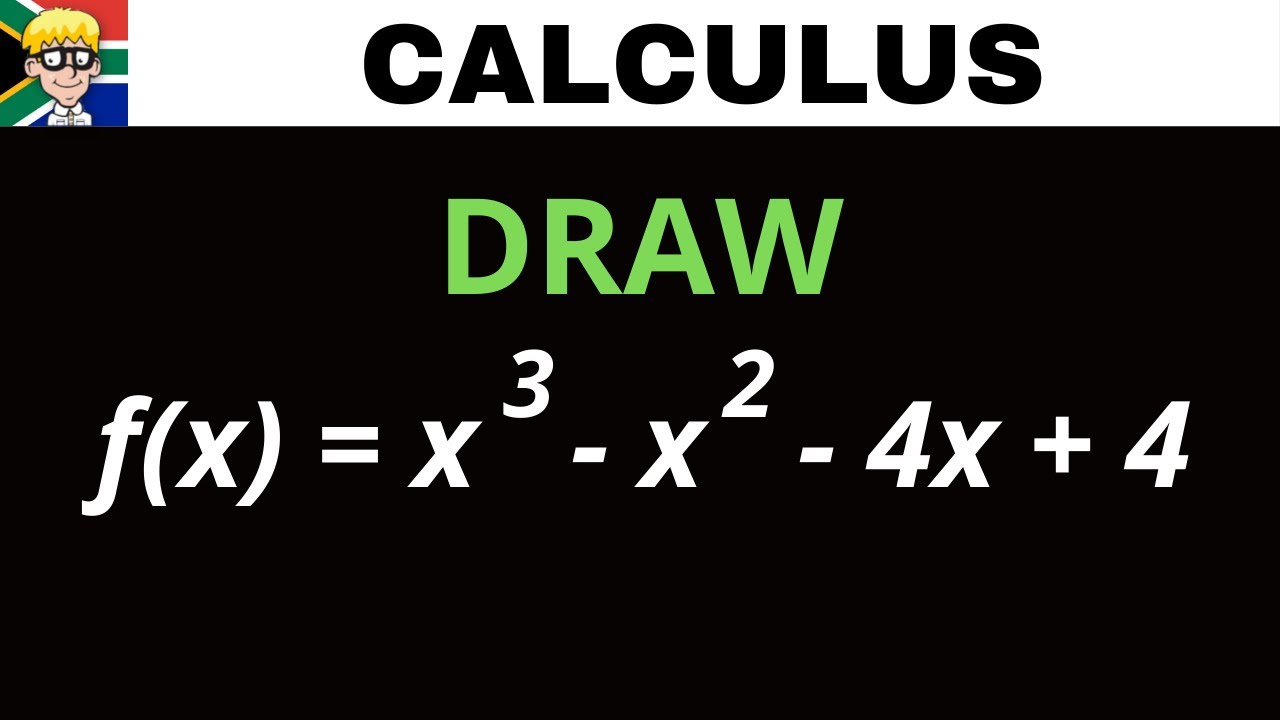
Calculus grade 12: Exam
TLDRThe video tutorial guides students through solving various calculus and algebra problems, including finding the coordinates of intercepts, turning points, and working with cubic equations. It emphasizes the importance of understanding fundamental concepts like factorizing cubic equations, applying the quadratic formula, and analyzing concave up and down regions of a graph. The instructor provides step-by-step explanations, making complex topics accessible while encouraging viewers to revisit foundational lessons if needed. This summary encapsulates the essence of the script, engaging users and sparking their interest in mastering these mathematical techniques.
Takeaways
- 🧮 The y-intercept (C) is found by setting x to 0, giving coordinates (0, 9).
- 🧠 To find x-intercepts (D, E, F), you need to factorize the cubic equation.
- 🔢 The first step in factorizing is guessing an x-value between 1 and 3; x=1 works here.
- 📏 After identifying one root, x=1, the equation can be broken down into factors.
- 🧩 You can determine the coefficients of the remaining quadratic by matching terms from expansion.
- ✖️ The quadratic formula or factoring method can be used to find the remaining x-intercepts.
- 📉 To find when the graph is concave down, the second derivative should be less than 0.
- 🆚 Concave up occurs when the second derivative is positive, and concave down occurs when it's negative.
- 🔄 The first derivative represents the gradient, and setting it to zero helps find turning points.
- 📊 For areas where the gradient is negative, the x-values lie between the two turning points found.
Q & A
What is the y-intercept of a graph and how do you find it?
-The y-intercept is the point where the graph of a function crosses the y-axis. To find the y-intercept, set x equal to zero in the equation of the graph, and solve for y. In the script, it is mentioned that if you set x to zero, you get y = 9, so the coordinates of the y-intercept are (0, 9).
How do you determine the x-intercepts of a graph?
-To find the x-intercepts, you set y equal to zero in the equation of the graph and solve for x. The script suggests guessing an x-value between one and three and substituting it into the equation to see if it yields zero, indicating an x-intercept.
What is the process of factorizing a cubic equation?
-Factorizing a cubic equation involves breaking down the cubic polynomial into simpler polynomials or binomials whose product gives the original cubic equation. The script suggests guessing an x-value to find one factor (e.g., x - 1) and then determining the other factors by comparing coefficients after multiplying the guessed factor with the remaining cubic polynomial.
How do you find the turning points of a graph?
-Turning points are the points on the graph where the gradient (slope of the tangent) changes sign. They occur where the first derivative of the function equals zero. The script explains finding the first derivative, setting it to zero, and solving for x to find the turning points.
What does it mean for a graph to be concave up or concave down?
-A graph is concave up if its second derivative is positive, meaning the graph curves like a smile. It is concave down if the second derivative is negative, curving like a frown. The script describes determining concavity by analyzing the sign of the second derivative of the function.
How do you determine the values of x for which a graph is concave down?
-To find the values of x for which the graph is concave down, you need to set the second derivative of the function less than zero. The script explains this by taking the second derivative, setting it to be less than zero, and solving for x to find the interval where the graph is concave down.
What is the significance of the first derivative being less than or equal to zero?
-When the first derivative is less than or equal to zero, it indicates where the gradient of the graph is negative or zero, which corresponds to the graph being decreasing or at a turning point. The script shows how to set the first derivative to be less than or equal to zero and solve for x to find these regions.
How can you find the x values for which the gradient of a graph is negative?
-To find where the gradient is negative, you can use the first derivative of the function. By setting the first derivative less than zero, you can find the x values where the graph is decreasing. The script demonstrates this by solving the inequality formed by the first derivative.
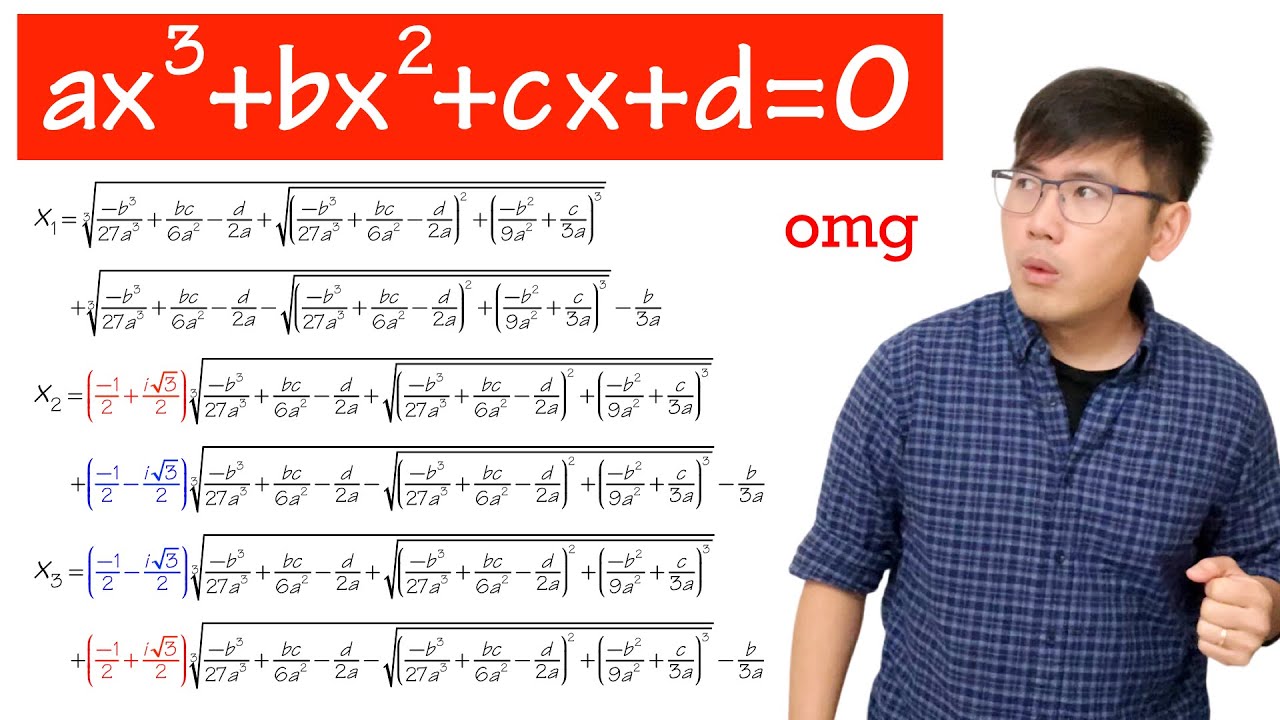
What is the quadratic formula and how is it used in the script?
-The quadratic formula is used to find the roots of a quadratic equation of the form ax^2 + bx + c = 0. It is x = (-b ± √(b^2 - 4ac)) / (2a). In the script, it is used to find the x values for which the first derivative equals zero, which are the turning points of the graph.
How does the script suggest finding the x-intercepts of a cubic equation?
-The script suggests initially guessing an x-value and substituting it into the cubic equation to see if it yields zero. If it does, this x-value is an x-intercept. The script then explains how to factorize the cubic equation to find the remaining x-intercepts without guessing.
What is the relationship between the x-intercepts and the factors of a cubic equation?
-The x-intercepts of a cubic equation are the values of x for which the equation equals zero. If a cubic equation is factorized into binomials, the x-intercepts are the values that make each binomial equal to zero. The script demonstrates this by factorizing the cubic equation and solving each binomial to find the x-intercepts.
Outlines
📍 Finding the y-Intercept and x-Intercepts of a Cubic Graph
The paragraph explains how to find the y-intercept (point C) and x-intercepts (points D, E, F) of a cubic graph. The y-intercept is found by setting x to 0, resulting in the coordinate (0, 9). For the x-intercepts, the process involves factorizing the cubic equation, starting with a guess for one of the x values. The method of trial and error is suggested, and the factorization process is discussed in detail, emphasizing the importance of understanding cubic equations for solving such problems.
🔍 Factorizing a Cubic Equation to Find x-Intercepts
This paragraph continues the discussion on finding the x-intercepts by factorizing the cubic equation. It covers the process of identifying factors by substituting guessed values and then breaking down the equation into simpler components. The explanation includes forming brackets, identifying constants, and using the quadratic formula when necessary. The paragraph concludes by summarizing the x-intercepts as D (-3, 0), E (1, 0), and F (3/2, 0), and suggests reviewing cubic factorization techniques for better understanding.
📈 Understanding Concavity and Finding Points of Inflection
The paragraph explains how to determine where a graph is concave down by using the second derivative of the function. It describes the difference between concave up (positive second derivative) and concave down (negative second derivative). The second derivative is calculated, and it's used to find the values of x where the graph is concave down, leading to the conclusion that x must be less than -1/6 for the graph to be concave down.
🧮 Using Derivatives to Identify Gradient Changes and Concave Intervals
This paragraph delves into using the first derivative to determine where the graph's gradient is zero, indicating turning points. It connects these points with the gradient sign, explaining how to identify intervals where the gradient is negative (concave down). The quadratic formula is employed to find specific x-values, and the paragraph concludes by discussing how to represent the intervals with negative gradients either using set notation or inequality symbols.
Mindmap
Keywords
💡Turning Point
💡X-Intercept
💡Y-Intercept
💡Factorization
💡Cubic Equation
💡Quadratic Formula
💡Second Derivative
💡Concave Down
💡Gradient
💡Inequality
Highlights
Identify the coordinates of the y-intercept C by setting x to zero, yielding C = (0, 9).
To find the x-intercepts (D, E, F), you need to factorize a cubic equation, making y equal to zero.
The process of factorizing a cubic equation can be simplified by guessing a value for x between 1 and 3.
If x = 1, substituting it into the equation results in y = 0, confirming x = 1 as a root.
Once one root is identified, the cubic equation can be further factorized into a quadratic equation to find the other x-intercepts.
Factorizing the cubic equation gives the x-intercepts: D = (-3, 0), E = (1, 0), and F = (3/2, 0).
Understanding how to factorize a cubic equation is crucial; once mastered, it simplifies solving these types of problems.
The second derivative of the function is used to determine where the graph is concave up or concave down.
A positive second derivative indicates the graph is concave up (smiley face), while a negative second derivative indicates it is concave down (sad face).
The value of x where the graph is concave down is found by setting the second derivative less than zero, resulting in x < -1/6.
The first derivative represents the gradient, and setting it less than or equal to zero helps identify intervals where the graph's gradient is negative.
By solving the inequality involving the first derivative, the x-values where the gradient is negative (concave down) are identified.
The turning points occur where the first derivative equals zero, leading to solutions for x at 1.26 and -1.59.
The interval where the gradient is negative lies between the turning points, from -1.59 to 1.26.
The method to solve for x where the gradient is negative can be done using grade 11 inequalities or by analyzing the behavior of the graph in calculus.
Transcripts


5.0 / 5 (0 votes)
Thanks for rating: