Elementary Stats Lesson #16
TLDRThis video script delves into statistical inference, focusing on estimating population parameters. It reviews the process of constructing confidence intervals for proportions and means, highlighting the formula and steps involved. The lecturer introduces the t-distribution, necessary when the population standard deviation is unknown, and demonstrates how to find critical t-values. Practical examples, such as estimating public opinion on tax rates and bacteria counts in milk, illustrate the application of these statistical methods. The script also discusses the impact of sample size and confidence level on margin of error, and the importance of assessing normality for small sample sizes.
Takeaways
- 📚 The class is focusing on statistical inference, particularly estimating population parameters such as mean and proportion.
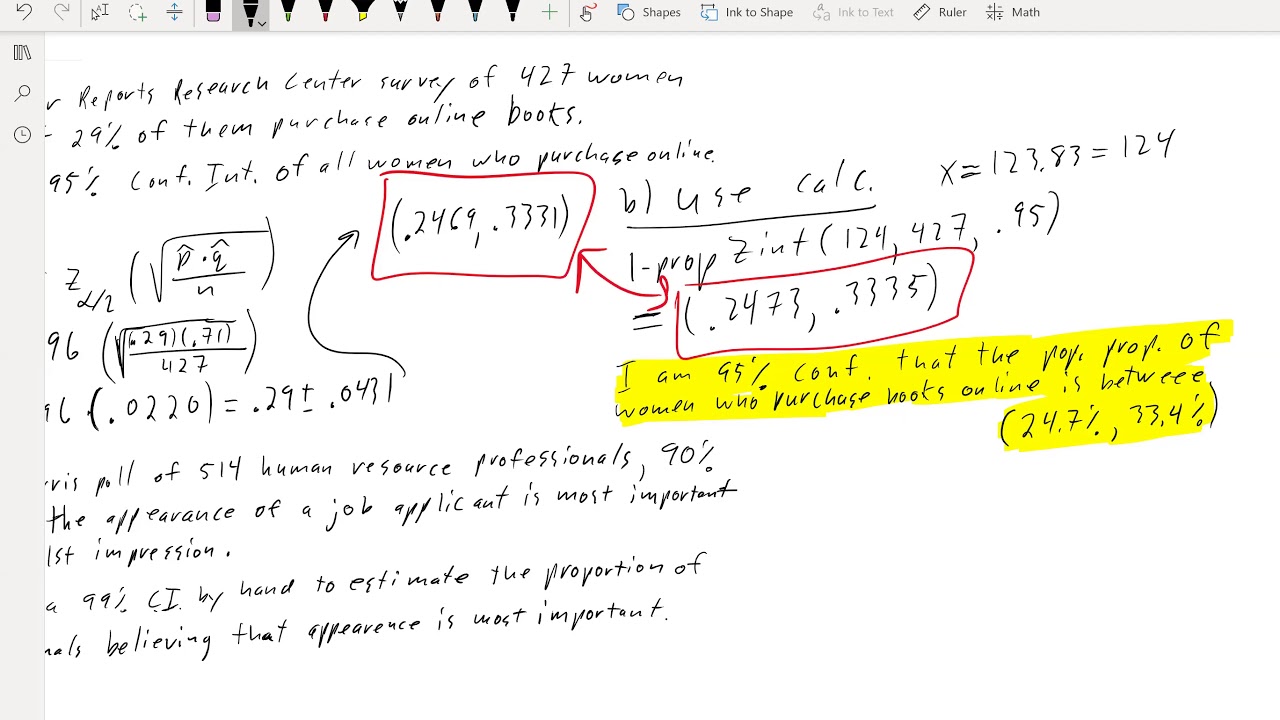
- 🔍 The process of constructing a confidence interval for a population proportion is reviewed, emphasizing the use of the sample proportion and the margin of error calculation.
- 📈 A formula for a confidence interval is detailed, highlighting the components such as point estimate, critical value, and standard error estimate.
- 📝 An example using Gallup poll data demonstrates the step-by-step construction of a 95% confidence interval for a population proportion.
- 🔢 The importance of calculating the sample mean and standard deviation is discussed for estimating the population mean, especially when the population standard deviation is unknown.
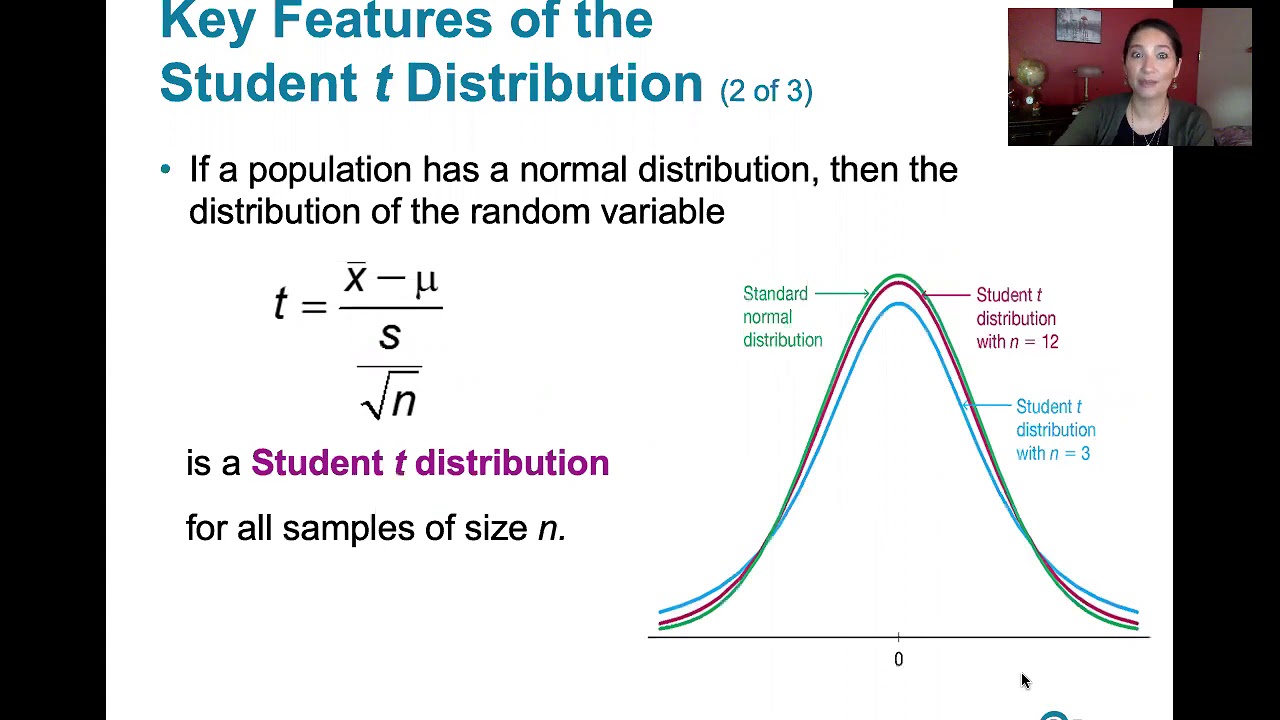
- 📉 The introduction of the t-distribution is explained as a result of using the sample standard deviation as an estimate for the population standard deviation, adding variability to the calculations.
- 📊 The properties of the t-distribution are outlined, showing its similarity to the normal distribution but with thicker tails due to the additional variability.
- 🔍 The use of t-tables or calculator programs to find critical t-values based on degrees of freedom and confidence levels is demonstrated.
- 🧐 The impact of sample size on the margin of error is discussed, noting that larger sample sizes result in smaller margins of error due to a smaller standard error estimate.
- 📉 The effect of increasing the confidence level on the margin of error is explained, showing that higher confidence levels result in wider intervals due to larger margins of error.
- 📝 Conditions for using confidence intervals with small sample sizes are discussed, emphasizing the need to assess population normality through normal probability plots.
Q & A
What is the main goal of the lesson discussed in the transcript?
-The main goal of the lesson is to estimate a population mean value and to construct confidence intervals for population proportions and means.
What is the formula for building a confidence interval for a population proportion?
-The formula for building a confidence interval for a population proportion is the sample proportion plus or minus the critical value (z*) times the standard error estimate, which is the square root of (p_hat * (1 - p_hat)) / n.
What is the critical value used in the Gallup poll example for a 95% confidence interval?
-The critical value used in the Gallup poll example for a 95% confidence interval is z.sub.025, which equals 1.96.
How does the process of estimating a population mean differ from estimating a population proportion?
-Estimating a population mean involves using the sample mean and the sample standard deviation, whereas estimating a population proportion uses the sample proportion. For the mean, we also introduce a second random variable when substituting the sample standard deviation for the population standard deviation, leading to the use of the t-distribution instead of the z-distribution.
Why is the t-distribution used instead of the z-distribution when estimating a population mean from a sample?
-The t-distribution is used because when estimating a population mean, we substitute the sample standard deviation for the unknown population standard deviation, introducing an additional random variable. This makes the z-distribution inappropriate due to the increased variability.
What is the main characteristic of the t-distribution that differentiates it from the z-distribution?
-The t-distribution is characterized by having heavier tails compared to the z-distribution, meaning it has more area in the tails, which accounts for the additional variability introduced by the sample standard deviation.
How does sample size affect the t-distribution?
-As the sample size increases, the t-distribution approaches the z-distribution. This is due to the law of large numbers, which means that for large samples, the t and z distributions become indistinguishable.
What is the process for finding critical t-values from the t-table?
-To find critical t-values from the t-table, locate the row corresponding to the degrees of freedom (n-1) and the column corresponding to the desired right-tail area, and the intersection provides the critical t-value.
How can a graphing calculator assist in finding t-values or constructing confidence intervals?
-A graphing calculator can assist by using the inverse t program, which requires the area to the left and the degrees of freedom as inputs, and it will output the t-score. Additionally, calculator programs can compute confidence intervals based on either raw data stored in a list or summary statistics.
What is the impact of changing the sample size on the margin of error in a confidence interval?
-As the sample size increases, the margin of error decreases due to a larger denominator in the standard error calculation and a smaller critical t-value from the t-distribution table.
What is the impact of changing the confidence level on the margin of error in a confidence interval?
-As the confidence level increases, the margin of error increases because a higher level of confidence requires a larger interval to capture the true population parameter value with the desired certainty.
What conditions must be satisfied to compute a reliable confidence interval for a small sample size?
-For a small sample size, the normality of the population must be assessed, typically by constructing and analyzing a normal probability plot for a linear pattern, which indicates that the population is approximately normally distributed.
Outlines
📚 Introduction to Statistical Inference
The instructor welcomes students to a new phase of the semester focused on statistical inference, specifically estimating a population mean. The lesson references section 9.2 and lesson 16, aiming to build on previous work estimating population proportions. The process involves reviewing a Gallup poll example from 2010, calculating a 95% confidence interval for the proportion of Americans who believe their federal income tax is too high, and using a formula involving the sample proportion, margin of error, and the z-critical value.
🔍 Transition to Estimating Population Mean
The lesson shifts focus to estimating the population mean, with a detour to discuss the t-distribution due to an issue with estimating the population standard deviation. The example involves the weight of pennies minted after 1982, where the sample mean and standard deviation are calculated. The challenge arises when attempting to estimate the population mean without knowing the population standard deviation, leading to the use of the sample standard deviation as an estimate and introducing additional variability.
📉 Exploring the T-Distribution
The instructor explains the t-distribution, which is necessary when estimating the population mean due to the additional variability from using the sample standard deviation. The t-distribution is described as similar to the normal distribution but with more area in the tails, making it suitable for smaller sample sizes. The t-distribution is specific to different sample sizes, indicated by degrees of freedom, and converges to the normal distribution as sample size increases.
📝 T-Distribution Table and Calculator Usage
The lesson details how to use the t-distribution table to find critical values for constructing confidence intervals, with examples provided. It also mentions the calculator's inverse t-program as an alternative to the t-table for finding these critical values. The process involves identifying the degrees of freedom and the desired confidence level to select the appropriate t-score.
🧬 Constructing Confidence Intervals for Population Mean
The instructor outlines the steps for constructing a confidence interval for the population mean, emphasizing the use of the t-distribution for critical values. The process is demonstrated using an example of bacteria counts in pasteurized milk, with calculations done both manually and using a calculator. The importance of the sample size and the central limit theorem in ensuring the approximation's accuracy is highlighted.
🔬 Impact of Sample Size and Confidence Level
The lesson explores how changes in sample size and confidence level affect the margin of error in confidence intervals. Examples compare intervals with different sample sizes and confidence levels, illustrating that larger sample sizes reduce the margin of error and higher confidence levels increase it. The importance of these factors in statistical analysis is emphasized.
📊 Assessing Normality for Small Samples
For small sample sizes, the instructor discusses the need to assess the normality of the population before constructing confidence intervals. This is done using a normal probability plot, where a linear pattern indicates normality. The method for constructing and interpreting these plots is briefly mentioned, setting the stage for hypothesis testing in future lessons.
🚀 Conclusion and Preview of Hypothesis Testing
The instructor concludes the lesson by summarizing the importance of estimating population parameters and previews the next topic: hypothesis testing. The upcoming lessons will focus on evaluating claims about parameter values, teaching students how to test these claims and determine their accuracy using statistical methods.
Mindmap
Keywords
💡Statistical Inference
💡Confidence Interval
💡Population Proportion
💡Sample Proportion
💡Margin of Error
💡Critical Value
💡Standard Error
💡Degrees of Freedom
💡t-Distribution
💡Normal Probability Plot
Highlights
Introduction to statistical inference and estimating a population mean.
Review of the process for estimating a population proportion with a confidence interval.
Explanation of the formula for a confidence interval for a population proportion.
Gallup poll example used to demonstrate the construction of a confidence interval.
Three-step process for constructing a 95% confidence interval for a population proportion.
Calculation of the sample proportion and standard error in the Gallup poll example.
Use of the z-score for the critical value in the confidence interval calculation.
Transition to estimating a population mean and the associated challenges.
Introduction of the t-distribution as an alternative to the z-distribution for smaller sample sizes.
Properties and characteristics of the t-distribution explained.
How the t-distribution converges to the z-distribution as sample size increases.
Explanation of the t-table and how to find critical t-values.
Demonstration of using a calculator to find t-scores and construct confidence intervals.
Impact of sample size on the margin of error and confidence interval width.
The effect of confidence level on the size of the margin of error.
Conditions for using confidence intervals with small sample sizes, including normality assessment.
Upcoming topics on hypothesis testing and evaluating claims about parameter values.
Transcripts
Browse More Related Video

Elementary Statistics - Chapter 7 - Estimating Parameters and Determining Sample Sizes Part 2
7.2.0 Estimating a Population Mean - Lesson Overview, Key Concepts, Learning Outcomes
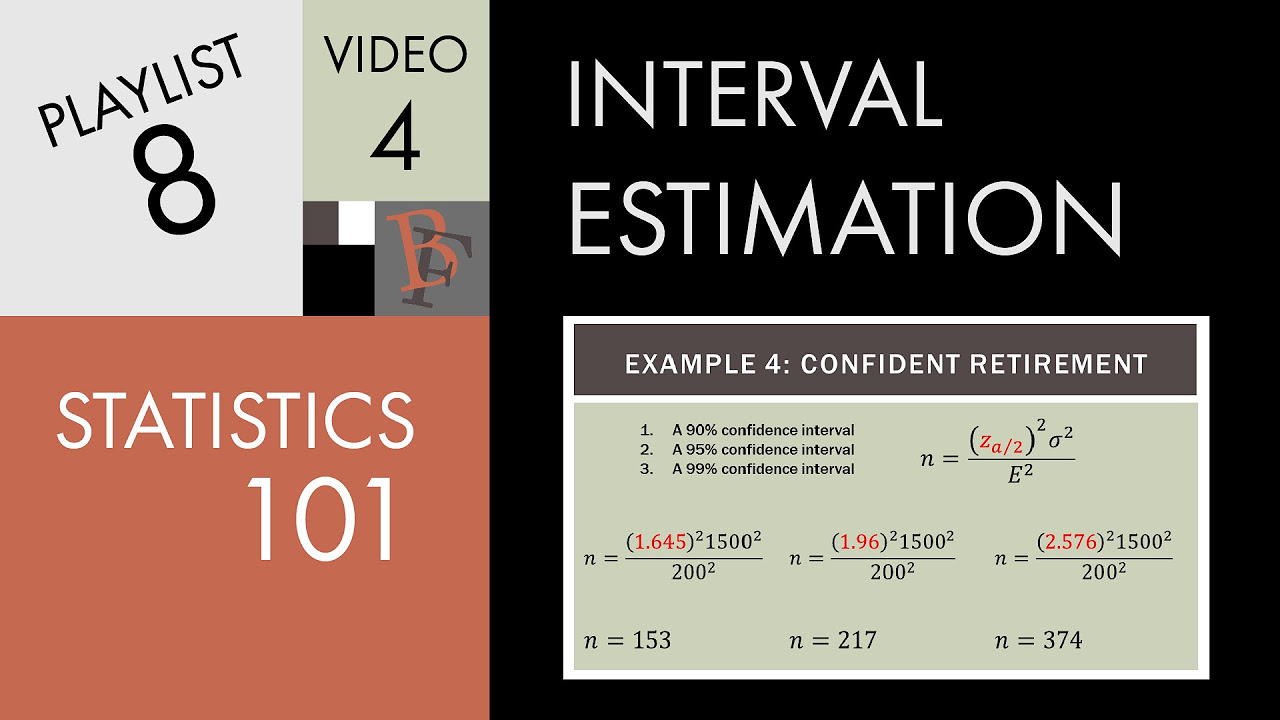
Statistics 101: Confidence Intervals, Estimating Sample Size Needed

Math 119 Chap 7 part 1
7.2.1 Estimating a Population Mean - Student t Distribution and Finding Critical t Values
Math 119 Chap 7 part 2
5.0 / 5 (0 votes)
Thanks for rating: