6.4.3 The Central Limit Theorem - The Rare Event Rule and the Central Limit Theorem
TLDRThis video script explores the intersection of the rare event rule and the central limit theorem in inferential statistics. It explains how observing events that contradict low-probability assumptions can indicate flawed premises, crucial for hypothesis testing. The script uses an elevator safety example to illustrate the computation and interpretation of low probabilities, emphasizing the importance of accurate data in statistical analysis and decision-making.
Takeaways
- 📚 The script discusses the application of the rare event rule in conjunction with the central limit theorem to compute and interpret low probabilities in inferential statistics.
- 🔍 The rare event rule states that if an event with a very low probability under a given assumption occurs significantly more or less often than expected, the assumption is likely incorrect.
- 📉 The rule plays a crucial role in hypothesis testing and influences the interpretation of probabilities derived from the central limit theorem.
- 🚫 Statisticians reject explanations based on very low probabilities, suggesting that if an unlikely event occurs, the initial assumption may be wrong.
- 🛠️ An example is given about elevator safety, where an outdated assumption about the mean weight of males leads to incorrect conclusions about the safety of an elevator.
- 📊 The script explains how to use a normal distribution to calculate the probability of an event, such as an elevator being overloaded, given a sample size and mean.
- 📐 The central limit theorem is used to determine that the sample means are normally distributed, allowing for the calculation of probabilities related to the sample mean.
- 📈 The use of outdated data (mean weight of 174 pounds) versus accurate data (mean weight of 189 pounds) dramatically changes the calculated probability of the elevator being overloaded.
- 🤔 The importance of using accurate population data is emphasized, as incorrect assumptions can lead to false conclusions about safety or other outcomes.
- 📝 The script demonstrates the process of calculating probabilities using both a z-table and Excel's norm.dist function, showing the impact of different data on the results.
- ⚠️ The rare event rule is applied to a real-world scenario, highlighting the potential for incorrect assumptions to lead to unsafe conditions if not challenged and revised.
Q & A
What is the rare event rule in the context of inferential statistics?
-The rare event rule states that if the probability of a particular observed event is very small under a given assumption, and the event occurs significantly less or more often than expected, it suggests that the assumption is likely incorrect.
How does the rare event rule play a role in hypothesis testing?
-The rare event rule is crucial in hypothesis testing as it helps in rejecting explanations based on very low probabilities, leading to the conclusion that the initial assumption might be wrong and prompting a reevaluation of the hypothesis.
What is the central limit theorem, and how does it relate to the rare event rule?
-The central limit theorem states that the distribution of sample means will be approximately normal regardless of the distribution of the population, given a sufficiently large sample size. It is used in conjunction with the rare event rule to compute and interpret low probabilities, influencing the interpretation of results when a rare event occurs more or less frequently than expected.
Why is it important to use accurate data when applying the central limit theorem and the rare event rule?
-Using accurate data is essential because it ensures the validity of the conclusions drawn from the application of the central limit theorem and the rare event rule. Inaccurate data can lead to incorrect assumptions and erroneous interpretations of probabilities, which can have significant implications in real-world applications.
Can you provide an example from the script that illustrates the application of the rare event rule and the central limit theorem?
-The script provides an example of elevator safety. It discusses the probability of an elevator being overloaded with 27 male passengers, using an outdated mean weight of 174 pounds. The example shows how the rare event rule and the central limit theorem are used to compute the probability of overload and interpret the results, highlighting the importance of accurate data.
What is the significance of the safety factor in the context of the elevator example?
-The safety factor, in this case, 25, is used to ensure that the elevator can carry a load 25% greater than its stated limit. This means the elevator is designed to handle a weight that is 25% more than its maximum capacity to ensure safety.
How does the outdated mean weight of males affect the interpretation of the elevator's safety?
-Using an outdated mean weight of 174 pounds makes the elevator appear safe, with a 7% chance of being overloaded. However, if the true mean weight is closer to 189 pounds, the probability of overload increases significantly to 70%, indicating that the elevator may not be as safe as initially thought.
What is the process of finding the probability that the elevator is overloaded using the normal distribution?
-The process involves calculating the sample mean, determining the standard deviation of the sample means, converting the sample mean to a z-score, and then using a z-table or technology like Excel to find the area to the left of the z-score. The area to the right, which represents the probability of the elevator being overloaded, is then found by subtracting the area to the left from 1.
How can Excel be used to find the probability of the elevator being overloaded?
-Excel can be used by applying the NORM.DIST function with the appropriate arguments: the x value (sample mean), the mean of the distribution (population mean), the standard deviation of the sample means, and setting 'TRUE' for the 'cumulative' argument to find the area to the left. The area to the right is then calculated by subtracting this value from 1.
What is the implication of the rare event rule when the observed event occurs more frequently than expected?
-If a rare event occurs more frequently than the probability suggests, it indicates that the initial assumption or hypothesis might be incorrect. This could lead to a reevaluation of the assumptions and a search for a more accurate explanation of the observed phenomenon.
How does the script suggest that the rare event rule can be applied in real-world scenarios like elevator safety?
-The script suggests that if the elevator continues to break despite statistical predictions indicating a low probability of overload, it might be a sign that the initial assumptions, such as the mean weight of men, are incorrect. Reevaluating these assumptions with more accurate data can lead to better safety measures and design.
Outlines
📚 Introduction to Rare Event Rule and Central Limit Theorem
This paragraph introduces the concept of combining the rare event rule with the central limit theorem for inferential statistics. The rare event rule states that if an event with a very low probability occurs significantly more or less often than expected, the underlying assumption may be incorrect. This principle is crucial for hypothesis testing and interpreting probabilities derived from the central limit theorem. An example involving elevator safety and the potential flaw in assuming outdated statistical data is presented to illustrate the application of these concepts.
📉 Applying the Central Limit Theorem to Elevator Safety
The second paragraph delves into the application of the central limit theorem to calculate the probability of an overloaded elevator using outdated mean weight data for males. It explains how the sample mean of weights is normally distributed with a specific mean and standard deviation. The process of graphing the normal distribution, finding the z-score for a sample mean of 185 pounds, and using it to determine the probability of overload is detailed. The paragraph also discusses using technology like Excel for a more accurate calculation than traditional z-tables.
🔢 Reevaluating Elevator Safety with Accurate Data
This paragraph emphasizes the importance of using accurate data in statistical analysis. It contrasts the probability of an elevator being overloaded using outdated versus updated mean weight data for males. The outdated data suggests a 7% chance of overload, while the updated data indicates a 70% chance, highlighting the drastic impact of accurate data on safety assessments. The paragraph concludes by stressing the necessity of revisiting assumptions and calculations with current data to ensure safety.
🚫 The Implications of Incorrect Assumptions in Statistics
The final paragraph discusses the consequences of relying on incorrect assumptions in statistical analysis, using the example of the elevator's safety. It explains how the rare event rule can be applied to question the validity of the initial assumption when the observed frequency of an event deviates significantly from the expected probability. The paragraph concludes by illustrating how discovering the inaccuracy of the mean weight assumption led to a more accurate understanding of the elevator's safety, reinforcing the importance of accurate data in statistical interpretation.
Mindmap
Keywords
💡Rare Event Rule
💡Inferential Statistics
💡Central Limit Theorem
💡Hypothesis Testing
💡Normal Distribution
💡Sample Mean
💡Standard Deviation
💡Z-Score
💡Probability
💡Excel
💡Safety Factor
Highlights
The Rare Event Rule states that if an observed event with a very low probability occurs significantly more or less often than expected, the underlying assumption is likely incorrect.
The Rare Event Rule is crucial in hypothesis testing and influences the interpretation of probabilities derived from the Central Limit Theorem.
If a low-probability event occurs more frequently than expected, it suggests that the original assumptions may be flawed.
The video discusses the application of the Rare Event Rule in conjunction with the Central Limit Theorem to interpret low probabilities.
An example of elevator safety is used to illustrate the application of statistical principles in real-world scenarios.
The video explains that a 25% safety factor is commonly used in elevator design to ensure they can carry a load 25% greater than the stated limit.
The outdated assumption of an average male weight of 174 pounds is used in the example, which may not accurately represent current population data.
The probability of an elevator being overloaded with 27 male passengers is calculated using the normal distribution of weights and the Central Limit Theorem.
The video demonstrates how to calculate the z-score to find the probability of the sample mean exceeding a certain weight.
Using Table A2 and Excel, two methods are shown to estimate the probability of the elevator being overloaded.
The initial calculation suggests a 7% chance of overload, but this is based on outdated data.
The importance of using accurate population data is emphasized, as it can significantly change the interpretation of probabilities.
Recalculating with an updated mean weight of 189 pounds for men shows a 70% chance of overload, highlighting the impact of accurate data on safety assessments.
The video concludes that the Rare Event Rule and the Central Limit Theorem are essential tools for interpreting statistical results and making informed decisions.
The discussion emphasizes the need for accurate assumptions in statistical analysis to avoid incorrect conclusions about safety or risk.
The video provides a practical example of how statistical methods can be applied to assess and improve safety standards in design.
The use of technology, such as Excel, is shown to provide a more accurate estimation of probabilities compared to manual calculations.
The video illustrates the process of re-evaluating assumptions when observed outcomes do not align with expected probabilities, as per the Rare Event Rule.
Transcripts
Browse More Related Video

4.1.4 Basics of Probability - The Rare Event Rule of Inferential Statistics
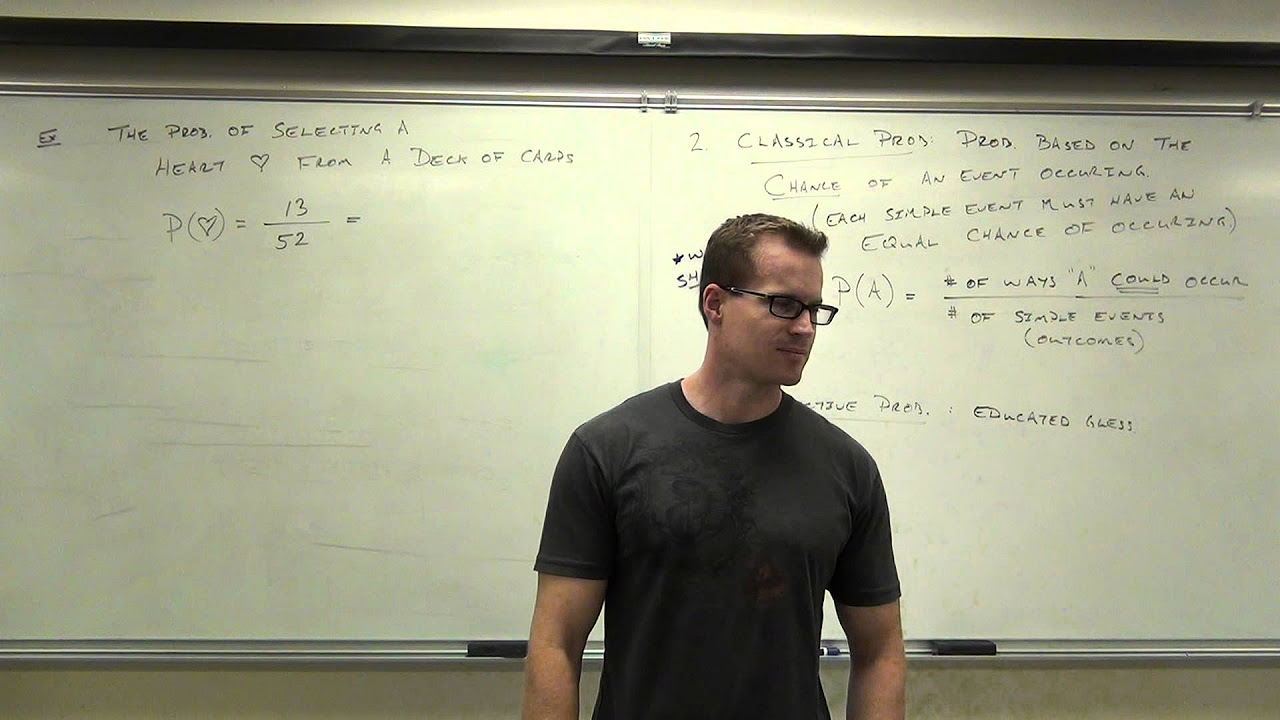
Statistics Lecture 4.2: Introduction to Probability
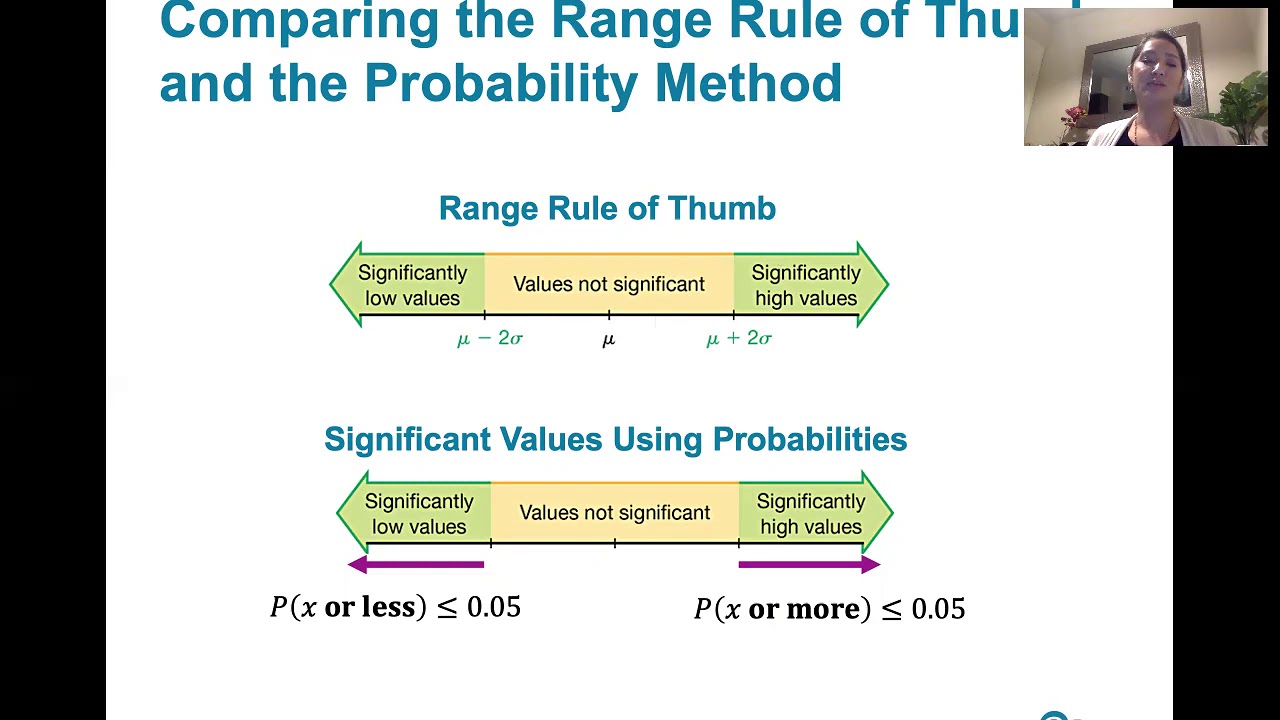
5.1.5 Discrete Probability Distributions - Use Probabilities to Determine Significant Values

Tutorial 1- What Is Statistics And What Are Its Types In Hindi?
The Normal Distribution, Clearly Explained!!!
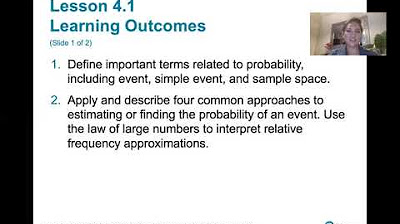
4.1.0 Basics of Probability - Lesson Overview, Key Concepts and Learning Outcomes
5.0 / 5 (0 votes)
Thanks for rating: