Bernoulli Distribution
TLDRThis lecture introduces the Bernoulli distribution, a probability model for binary outcomes, denoted as 'Bern(p)'. It's applicable to events with a single trial and two possible outcomes, such as a coin toss or a yes/no question. The distribution graph features two bars, one for each outcome, with heights corresponding to probabilities 'p' and '1-p'. The expected value is either 'p' or '1-p', depending on the assignment of outcomes. The variance is consistently 'p * (1-p)', regardless of the expected value. An example with an unfair coin illustrates the calculation of expected value and variance, highlighting the elegant simplicity of Bernoulli distribution characteristics.
Takeaways
- 📚 The Bernoulli distribution is denoted as 'Bern' followed by the probability of success in parentheses.
- 🎲 It is used for events with a single trial and two possible outcomes, such as a coin flip or a binary choice.
- 📊 The graph of a Bernoulli distribution features two bars, one for each outcome, with heights corresponding to the probabilities p and 1-p.
- 🔢 The expected value of a Bernoulli distribution can be either p or 1-p, depending on the assignment of outcomes to 0 and 1.
- 💡 The higher probability is conventionally assigned to 'p', and the lower to '1-p', with the event of probability 'p' often assigned a value of 1.
- 🧮 The variance of a Bernoulli distribution is always 'p times (1-p)', a formula that applies regardless of the expected value.
- 📉 The standard deviation of a Bernoulli event is the square root of the variance, which also equals 'p times (1-p)'.
- 🪙 An example of an unfair coin with a 60% chance of tails would have an expected value of 0.6 and a variance of 0.24.
- 📈 The expected value reflects the likelihood of the favored event occurring in a single trial.
- 🔑 The Bernoulli distribution is elegant in its simplicity, with straightforward formulas for variance and standard deviation.
- 📝 Understanding the Bernoulli distribution is crucial for analyzing binary outcomes in various experimental or real-world scenarios.
Q & A
What does 'Bern' represent in the context of the lecture?
-In the context of the lecture, 'Bern' is a shorthand notation used to define a Bernoulli distribution.
How is a Bernoulli distribution typically represented?
-A Bernoulli distribution is typically represented by the variable 'X' following a Bernoulli distribution with a probability of success equal to 'p'.
What kind of events are suitable for a Bernoulli distribution?
-Events with only one trial and two possible outcomes, such as a coin flip or a True/False quiz question, are suitable for a Bernoulli distribution.
What are the two possible outcomes in a Bernoulli distribution graph?
-The two possible outcomes in a Bernoulli distribution graph are represented by two bars, one for each outcome, with one bar reaching the probability 'p' and the other reaching '1 - p'.
How do you assign the outcomes for a Bernoulli distribution?
-In a Bernoulli distribution, one outcome is usually assigned the value 0 and the other the value 1, with the higher probability event often assigned the value 1.
What is the expected value of a Bernoulli distribution and how is it calculated?
-The expected value of a Bernoulli distribution is either 'p' or '1 - p', depending on the assignment of the outcomes, and it represents the likelihood of the favored event occurring.
What is the variance of a Bernoulli distribution and how is it calculated?
-The variance of a Bernoulli distribution is always 'p times (1 - p)', regardless of the expected value.
How does the variance formula apply to an unfair coin flip scenario?
-In the case of an unfair coin flip where the probability of tails (assigned as 1) is 0.6, the variance would be calculated as 0.6 times 0.4, resulting in 0.24.
Why is the variance of a Bernoulli distribution always 'p times (1 - p)'?
-The variance formula for a Bernoulli distribution always results in 'p times (1 - p)' because it reflects the product of the probability and its complement, which is a fundamental property of Bernoulli events.
What is the significance of the expected value in a Bernoulli distribution?
-The expected value in a Bernoulli distribution signifies the average outcome of the event over many trials, indicating the likelihood of the favored event occurring.
How does the lecture illustrate the elegance of certain distribution characteristics?
-The lecture illustrates the elegance of certain distribution characteristics by showing that despite different scenarios, the variance of a Bernoulli distribution always follows the simple formula of 'p times (1 - p)'.
Outlines
📊 Introduction to Bernoulli Distribution
This paragraph introduces the Bernoulli distribution, denoted as 'Bern', which is used to model events with a single trial and two possible outcomes, such as a coin toss or a binary choice. The distribution is characterized by a probability of success 'p'. The graph of a Bernoulli distribution is simple, consisting of two bars representing the probabilities of the two outcomes. The expected value is calculated based on the assignment of outcomes to 0 and 1, and it can be either 'p' or '1 - p'. The variance is always 'p * (1 - p)', regardless of the expected value.
Mindmap
Keywords
💡Bernoulli Distribution
💡Probability of Success (p)
💡Trial
💡Outcomes
💡Graph
💡Expected Value
💡Variance
💡Unfair Coin
💡Experimental Probability
💡Assignment of 0 and 1
Highlights
Introduction to the Bernoulli distribution and its notation using 'Bern' followed by the probability of success.
Definition of events suitable for a Bernoulli distribution: single-trial events with two possible outcomes.
Examples of Bernoulli distribution applications: coin flips, True/False quiz questions, and US election voting.
Explanation of how probabilities or past data are used in Bernoulli distributions.
Description of the Bernoulli distribution graph with two bars representing the two possible outcomes.
Assignment of outcomes to 0 and 1 in Bernoulli distributions and its impact on expected value calculations.
Calculation of expected value in Bernoulli distributions, which can be either 'p' or '1 - p'.
Conventional assignment of the higher probability to 'p' and the event with probability 'p' to value 1.
Explanation of the expected value as a measure of the likelihood of the favored event in a single trial.
Derivation of the variance formula for Bernoulli distributions as 'p * (1 - p)'.
Observation of the elegant characteristics of Bernoulli distributions in variance calculation.
Application of variance and standard deviation formulas in the context of Bernoulli distributions.
Example of calculating expected value and variance for an unfair coin with a 60% tails probability.
Assignment of tails as outcome 1 with a probability of 0.6, leading to an expected value of 0.6.
Calculation of variance for the unfair coin example, resulting in a variance of 0.24.
Conclusion and acknowledgment of the audience's understanding of Bernoulli distribution concepts.
Transcripts
Browse More Related Video
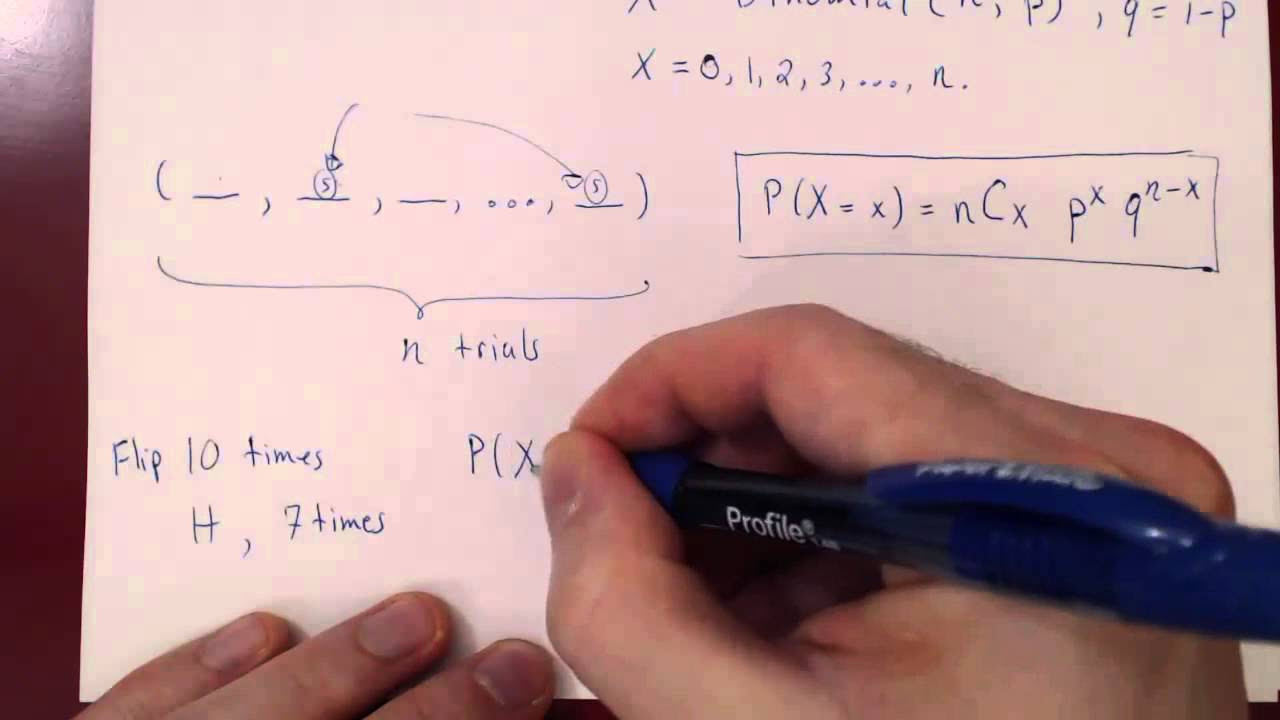
Bernoulli, Binomial and Poisson Random Variables

Expected value of binomial distribution | Probability and Statistics | Khan Academy
How to calculate p-values
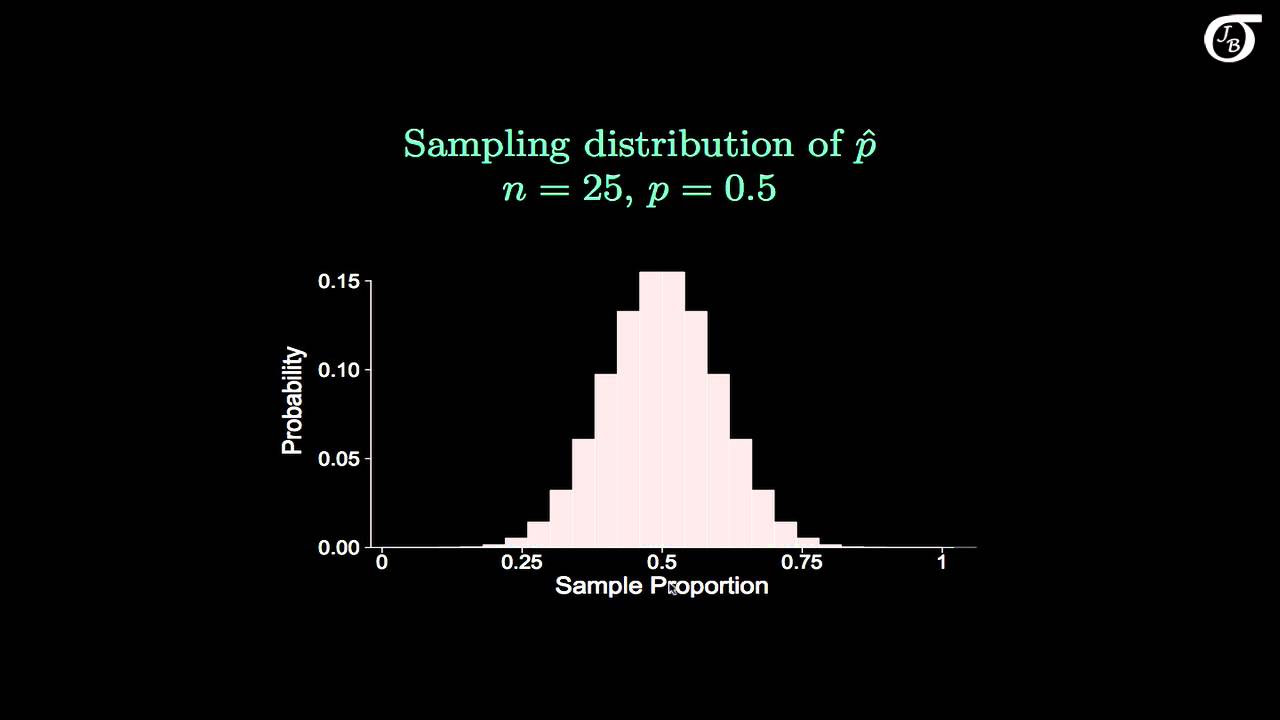
The Sampling Distribution of the Sample Proportion

What is p-value? How we decide on our confidence level.

Margin of error 1 | Inferential statistics | Probability and Statistics | Khan Academy
5.0 / 5 (0 votes)
Thanks for rating: