The Sampling Distribution of the Sample Proportion
TLDRThis video script explores the sampling distribution of the sample proportion, denoted as P-hat. It explains how P-hat is used to estimate the population proportion, P, and delves into its characteristics when sampled from an infinite or a large population. The script discusses the binomial nature of P-hat, its mean and variance, and the conditions under which its distribution can be approximated by a normal distribution. It also provides a guideline for when this approximation is reasonable, emphasizing the importance of sample size relative to the value of P.
Takeaways
- 🔍 The sample proportion, denoted as P hat, is the proportion of individuals or objects in the sample that have a certain characteristic.
- 📊 In the given example, the sample proportion P hat is calculated as 18 out of 200, which is 0.09.
- 🧮 P hat is used to estimate the population proportion P in statistical inference.
- 📈 The sampling distribution of P hat is based on the binomial distribution, making P hat a discrete random variable.
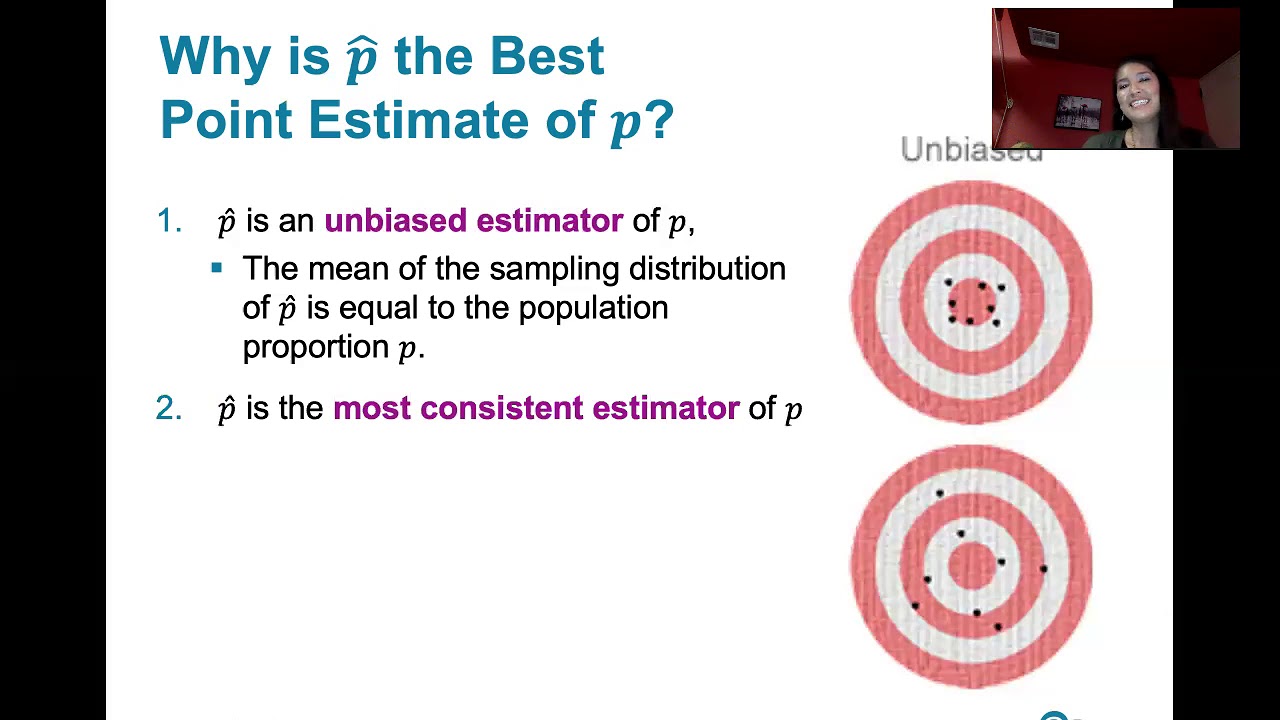
- 🔄 The mean of the sampling distribution of P hat is equal to the population proportion P, making P hat an unbiased estimator of P.
- 📉 The variance of the sampling distribution of P hat is given by P times (1 minus P) divided by n.
- ⚖️ The standard deviation of the sampling distribution of P hat is the square root of the variance.
- 📐 For large sample sizes, the sampling distribution of P hat is approximately normal, according to the central limit theorem.
- 📏 The normal approximation is more accurate when P is close to 0.5 and requires larger sample sizes when P is close to 0 or 1.
- 📖 A rough guideline for the normal approximation to be reasonable is that both nP and n(1-P) should be at least 15.
Q & A
What is the sample proportion denoted by P-hat?
-P-hat represents the proportion of individuals or objects in the sample that exhibit a certain characteristic, calculated as the number of individuals with the characteristic divided by the total sample size.
Why do we use the sample proportion P-hat in statistical inference?
-We use P-hat to estimate the population proportion P, as it helps in developing proper inference procedures when the entire population is not accessible or too large to measure directly.
What assumptions are made about the population when deriving the sampling distribution of P-hat?
-The assumptions include that the population is either infinite or that the sample is only a small fraction of a large finite population.
How is the sample proportion P-hat related to the binomial random variable X?
-P-hat can be viewed as X over n, where X is a binomial random variable representing the number of individuals in the sample with the characteristic of interest, and n is the total sample size.
What is the mean of the sampling distribution of P-hat?
-The mean of the sampling distribution of P-hat is equal to the population proportion P, making P-hat an unbiased estimator of P.
What is the variance of the sampling distribution of P-hat?
-The variance of P-hat is P times (1 - P) divided by n, where P is the population proportion and n is the sample size.
Under what conditions is the sampling distribution of P-hat approximately normal?
-The sampling distribution of P-hat is approximately normal for large sample sizes, but the exact size required depends on the value of P, with larger samples needed when P is close to 0 or 1.
What is the guideline for when the normal approximation of the sampling distribution of P-hat is reasonable?
-A reasonable guideline is that the sampling distribution of P-hat is approximately normal if n times P is at least 15 and n times (1 - P) is at least 15.
How does the skewness of the sampling distribution of P-hat change with different values of P?
-When P is 0.5, the distribution is symmetric. When P is closer to 0 or 1, there is skewness, with right skewness when P is close to 0 and left skewness when P is close to 1.
What is the impact of increasing the sample size on the normal approximation of the sampling distribution of P-hat?
-Increasing the sample size makes the sampling distribution of P-hat more closely approximate a normal distribution, especially when P is close to 0 or 1.
Outlines
📊 Understanding Sample Proportion Distribution
This paragraph introduces the concept of the sample proportion (\( \hat{P} \)) and its distribution. It uses an example of a manufacturing process where 18 out of 200 parts have major defects, resulting in a sample proportion of 0.09. The video script explains that \( \hat{P} \) is used to estimate the population proportion (\( P \)) in statistical inference. The characteristics of the sampling distribution of \( \hat{P} \) are explored, including its mean, variance, and standard deviation. The central limit theorem is mentioned, which states that for large sample sizes, \( \hat{P} \) is approximately normally distributed. However, the degree of approximation to normality depends on the value of \( P \), with smaller sample sizes needed when \( P \) is around 0.5 and larger samples when \( P \) is near 0 or 1. The binomial distribution is the basis for the sampling distribution of \( \hat{P} \), and the video script illustrates this with a detailed explanation of how the mean and variance of \( \hat{P} \) are derived from the binomial distribution.
📈 Visualizing the Sampling Distribution of \( \hat{P} \)
The second paragraph delves into the visual representation of the sampling distribution of the sample proportion \( \hat{P} \). It discusses how the distribution is centered at the population proportion \( P \) and how its shape changes with different sample sizes and values of \( P \). The script describes the skewness that occurs when \( P \) is not 0.5 and how increasing the sample size can lead to a more normal distribution. The video script provides a guideline for when the normal approximation is reasonable, suggesting that \( \hat{P} \) is approximately normal if \( n \times P \) and \( n \times (1 - P) \) are both at least 15. The paragraph concludes with a summary of the characteristics of the sampling distribution of \( \hat{P} \) for large sample sizes, which is approximately normal with a mean of \( P \) and a variance of \( P(1-P)/N \). These characteristics are essential for constructing confidence intervals and hypothesis tests for the population proportion \( P \).
Mindmap
Keywords
💡Sampling
💡Sample Proportion
💡Statistical Inference
💡Binomial Distribution
💡Central Limit Theorem
💡Mean
💡Variance
💡Standard Deviation
💡Normal Approximation
💡Confidence Intervals
💡Hypothesis Tests
Highlights
Exploration of the sampling distribution of the sample proportion, denoted as P-hat.
Example given with a random sample of 200 parts, where 18 had major defects, resulting in a sample proportion of 0.09.
P-hat is used to estimate the population proportion, P, in statistical inference scenarios.
Assumption of sampling from an infinite population or a small fraction of a large population.
P-hat is viewed as X over N, where X is the number of individuals with the characteristic of interest.
X is often considered a binomial random variable with parameters N and P, influencing the sampling distribution of P-hat.
P-hat is a discrete random variable with n+1 possible values, based on the binomial distribution.
The mean of the sampling distribution of P-hat is P, making it an unbiased estimator of the population proportion.
Variance of P-hat is calculated as P(1-P)/N, with standard deviation being the square root of this variance.
Normal approximation of P-hat's sampling distribution is possible for large sample sizes due to the central limit theorem.
The sample size required for normal approximation depends on the value of P, with larger sizes needed when P is near 0 or 1.
Exact sampling distribution of P-hat is shown for n=25 and P=0.5, illustrating binomial distribution characteristics.
Demonstration of how increasing sample size improves the normal approximation fit for P-hat's distribution.
For P close to 0.5, a smaller sample size is sufficient for the normal approximation, unlike when P is near 0 or 1.
Guidelines provided for when the sampling distribution of P-hat can be considered approximately normal.
Summary of the characteristics of P-hat's sampling distribution for constructing confidence intervals and hypothesis tests.
Transcripts
Browse More Related Video
7.1.1 Estimating a Population Proportion - The Best Point Estimate, Our Sample Proportion p-Hat
7.1.4 Estimating a Population Proportion - Margin of Error and Computing Confidence Intervals
9.1.1 Two Proportions - Rationale Behind Hypothesis Tests Involving Two Proportions

WHAT IS A "SAMPLING DISTRIBUTION" and how is it different from a "sample distribution"... and stuff
Visualizing the Binomial Distribution (6.6)

Confidence Interval for a population proportion | Solved Problems
5.0 / 5 (0 votes)
Thanks for rating: