Bernoulli, Binomial and Poisson Random Variables
TLDRThis educational video explores three types of discrete random variables: Bernoulli, Binomial, and Poisson. The Bernoulli variable, exemplified by a coin flip with two outcomes, has a success probability P and failure probability Q, with mean and variance calculated as P and PQ, respectively. The Binomial variable extends this concept to multiple trials, with parameters n (number of trials) and P, where the mean and variance are nP and nPQ. The Poisson variable, used for counting events in a fixed time interval, has a single parameter lambda representing both the mean and variance, with probabilities calculated using e^(-lambda) * lambda^X / X!. The video provides clear examples, such as flipping coins and counting cars, to illustrate these concepts.
Takeaways
- 🎲 The Bernoulli random variable represents a single trial with two possible outcomes, success or failure, such as flipping a coin.
- 📊 The probability of success for a Bernoulli trial is denoted by P, and the probability of failure is Q, which is 1 - P.
- 🧮 For a Bernoulli variable, the expected value (mean) is P, and the variance is P * Q, with the standard deviation being the square root of P * Q.
- 🚀 The binomial experiment is a sequence of repeated Bernoulli trials, and the binomial random variable X represents the total number of successes.
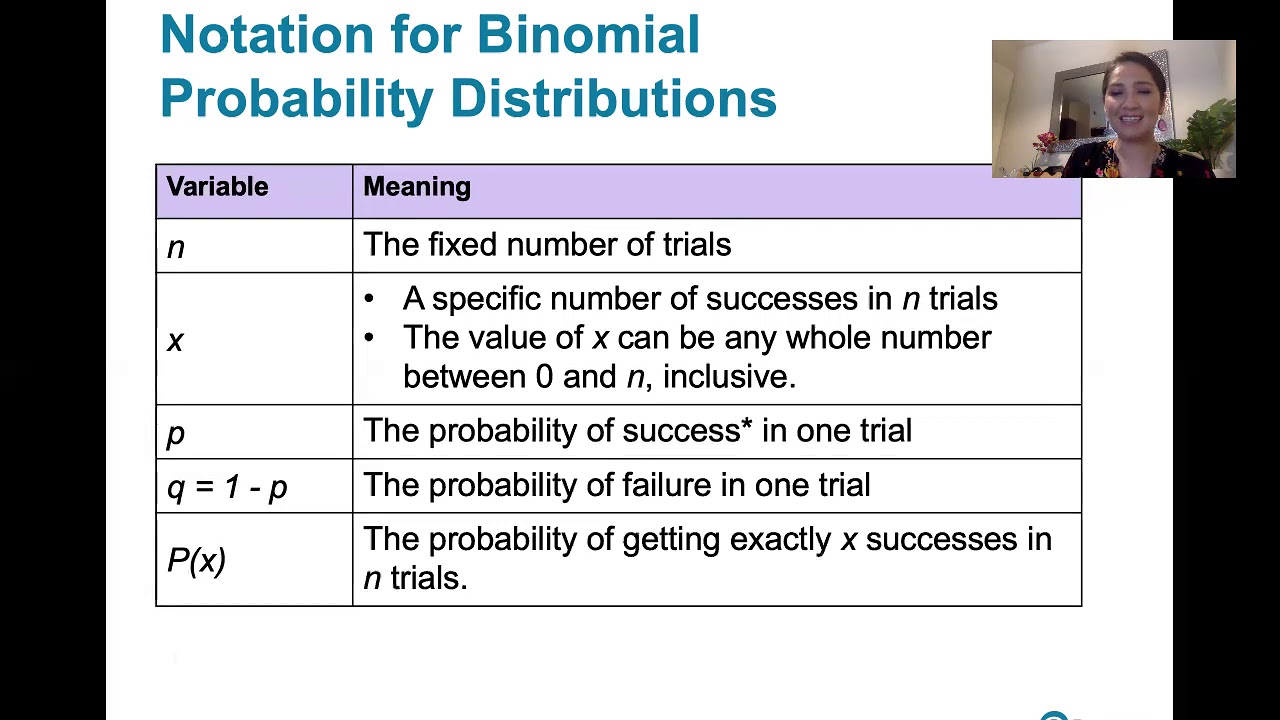
- 🔢 In a binomial distribution, there are two key parameters: n (number of trials) and P (probability of success in each trial).
- 🎯 The probability of getting exactly X successes in n trials of a binomial experiment is given by the binomial probability formula, which involves combinations (n choose X).
- 📚 The mean of a binomial random variable is n * P, and the variance is n * P * Q, indicating that both are dependent on the number of trials and the probability of success.
- 🌐 The Poisson experiment is used to model the number of events occurring in a fixed time interval, such as counting black cars passing by in 10 minutes.
- 🇬🇧 The Poisson distribution has one parameter, lambda (λ), which represents the average rate of events occurring in the given time interval.
- 📈 The mean and variance of a Poisson random variable are both equal to lambda, simplifying the calculation of expected values and dispersion.
- 📘 The probability of observing X events in a Poisson experiment is calculated using the formula e^(-λ) * (λ^X) / X!, where e is the base of the natural logarithm.
Q & A
What is a Bernoulli random variable?
-A Bernoulli random variable is the simplest type of discrete random variable that represents an experiment with exactly two possible outcomes, often labeled as 'success' or 'failure'. An example would be flipping a coin, where the outcomes are heads (success) and tails (failure).
What are the possible values of a Bernoulli random variable?
-The possible values of a Bernoulli random variable are 0 (representing failure) and 1 (representing success), corresponding to the two possible outcomes of the Bernoulli experiment.
What is the probability of success (P) and failure (Q) in a Bernoulli experiment?
-In a Bernoulli experiment, P is the probability of observing a success, and Q is the probability of observing a failure. By definition, Q is equal to 1 - P, ensuring that the total probability sums up to 1.
How is the mean of a Bernoulli random variable calculated?
-The mean (expected value) of a Bernoulli random variable is calculated as the probability of success (P) multiplied by the value of success (1) plus the probability of failure (Q) multiplied by the value of failure (0), which simplifies to just P.
What is the variance of a Bernoulli random variable?
-The variance of a Bernoulli random variable is calculated as the probability of success (P) times the probability of failure (Q), which is P * (1 - P) or PQ.
What is a binomial experiment and how does it relate to a Bernoulli experiment?
-A binomial experiment is a series of repeated Bernoulli trials, each with two possible outcomes (success or failure) and the same probability of success (P) for each trial. It is used to model situations where you want to know the number of successes in a fixed number of independent trials.
What are the parameters of a binomial distribution?
-The parameters of a binomial distribution are the number of trials (n) and the probability of success in each trial (P). These parameters are used to calculate the probability of achieving a certain number of successes.
How is the probability of a specific number of successes in a binomial experiment calculated?
-The probability of a specific number of successes (X) in a binomial experiment is calculated using the binomial probability formula, which is the combination of choosing X successes from n trials (n choose X) multiplied by P raised to the power of X and (1 - P) raised to the power of (n - X).
What is the mean and variance of a binomial random variable?
-The mean of a binomial random variable is the product of the number of trials (n) and the probability of success (P), or nP. The variance is the product of n, P, and (1 - P), or nP(1 - P).
What is a Poisson random variable and how does it differ from a Bernoulli or binomial random variable?
-A Poisson random variable is used to model the number of events occurring in a fixed interval of time or space, given a constant average rate of occurrence (lambda). Unlike Bernoulli and binomial variables, which have a fixed number of trials, a Poisson variable can have any number of occurrences, and the events do not have to be binary.
What is the probability mass function of a Poisson random variable?
-The probability mass function of a Poisson random variable is given by e^(-lambda) * (lambda^X) / X!, where lambda is the average rate of occurrence, X is the actual number of occurrences, and e is the base of the natural logarithm (approximately 2.71828).
What is the relationship between the mean and variance of a Poisson random variable?
-For a Poisson random variable, both the mean and the variance are equal to the parameter lambda, which represents the average rate of occurrence of the event.
Outlines
🎲 Introduction to Bernoulli Random Variables
The first paragraph introduces the concept of a Bernoulli random variable, which represents a simple experiment with only two possible outcomes: success or failure. The classic example used is flipping a coin, where heads is considered a success and tails a failure. The random variable X is defined as the number of successes in a single trial. The probabilities of success (P) and failure (Q, where Q = 1 - P) are the key parameters of the Bernoulli distribution. The expected value (mean) of X is P, and the variance is P*Q, indicating the deviation from the mean. The paragraph also touches on the implications of a fair or biased coin affecting these probabilities.
📊 Understanding the Binomial Distribution
The second paragraph delves into the binomial distribution, which is an extension of the Bernoulli experiment. It involves repeating the Bernoulli experiment a fixed number of times (n), and X is the total number of successes observed. The binomial distribution has two parameters: n, the number of trials, and P, the probability of success in each trial. The probability of obtaining exactly X successes is calculated using combinations (n choose X), multiplied by the probability of success (P) raised to the power of X and the probability of failure (Q) raised to the power of (n - X). The mean and variance of a binomial random variable are nP and nPQ, respectively. The paragraph also provides an example of calculating the probability of getting a certain number of heads when flipping a coin ten times.
🔢 Summation of Bernoulli Variables in Binomial Experiments
This paragraph explains that a binomial experiment can be viewed as the sum of n Bernoulli random variables, each representing a single trial with its own success or failure outcome. Since the trials are independent, the mean of the binomial variable is simply the sum of the means of the individual Bernoulli variables, which is nP. Similarly, the variance of the binomial variable is the sum of the variances of the Bernoulli variables, resulting in nPQ. This understanding simplifies the calculation of the mean and variance for a binomial random variable.
🚦 Exploring the Poisson Distribution
The fourth paragraph introduces the Poisson distribution, which is used to model the number of events occurring in a fixed time interval. The parameter lambda (λ) represents the average rate of events occurring per time interval. The mean and variance of a Poisson random variable are both equal to lambda. The probability of observing X events in a given time interval is calculated using the formula e^(-lambda) * (lambda^X) / X!, where e is the base of the natural logarithm. An example is provided where someone counts the number of black cars passing by in a 10-minute interval, with an average of six black cars observed, and the probability of observing eight black cars is calculated.
📘 Conclusion and Acceptance of Poisson Formulas
The final paragraph acknowledges the complexity of proving the formulas for the Poisson distribution and suggests that they will be accepted without proof. It emphasizes the practical use of these formulas in various applications, such as counting the number of cars or other events over a fixed time period, and provides a brief overview of the process involved in calculating probabilities using the Poisson distribution.
Mindmap
Keywords
💡Bernoulli Random Variable
💡Binomial Experiment
💡Poisson Experiment
💡Mean
💡Variance
💡Probability
💡Success and Failure
💡Combination
💡Exponential Function
💡Factorial
Highlights
Introduction to three special examples of discrete random variables.
Explanation of the Bernoulli random variable and its experiment involving a single trial with two outcomes.
Example of a Bernoulli experiment: flipping a coin with outcomes heads (success) and tails (failure).
Definition of the random variable X in a Bernoulli experiment as the number of successes.
Probabilities of success (P) and failure (Q) in a Bernoulli distribution, with Q being 1 - P.
Calculation of the mean and variance for a Bernoulli random variable, with mean = P and variance = P*Q.
Introduction to the binomial experiment, which involves repeating a Bernoulli experiment multiple times.
Parameters of the binomial distribution: number of trials (n) and probability of success (P).
Method to calculate the probability of a given number of successes in a binomial experiment using combinations.
Example calculation of the probability of getting a certain number of heads when flipping a coin multiple times.
Mean and variance of a binomial random variable, with mean = n*P and variance = n*P*Q.
Understanding that a binomial experiment is a sum of Bernoulli random variables and implications for mean and variance.
Introduction to the Poisson experiment, which observes the number of occurrences of an event in a fixed time interval.
Parameter lambda (λ) of the Poisson distribution, representing the mean and variance of the random variable.
Example of a Poisson experiment: counting the number of black cars passing by in a 10-minute interval.
Formula for the probability of observing a certain number of events in a Poisson distribution.
Calculation example of the probability of observing a specific number of black cars in a given time interval.
Explanation of the Poisson distribution's properties and its use in modeling events with a fixed average rate.
Transcripts
Browse More Related Video

Data Science & Statistics Tutorial: The Poisson Distribution

Math 119 Chapter 5 part 2

Poisson process 1 | Probability and Statistics | Khan Academy
5.2.1 Binomial Probability Distributions - Is this procedure described by a binomial distribution?

Visualizing the Binomial Distribution (6.6)

Bernoulli Distribution
5.0 / 5 (0 votes)
Thanks for rating: