How to calculate p-values
TLDRIn this engaging StatQuest video, host Josh Starman explains the concept of p-values and their significance in statistical analysis. He begins by differentiating between one-sided and two-sided p-values, emphasizing the common use and potential dangers of one-sided p-values. Through the example of a coin flip, Starman illustrates how p-values are calculated by adding up probabilities and how they are used to test hypotheses, with a focus on the null hypothesis. He further clarifies the distinction between the probability of an event and the p-value, and why considering equally rare or more extreme outcomes is important in the calculation. The video also explores the application of p-values in continuous data scenarios, using the example of height distributions. Starman concludes with a cautionary note on the misuse of one-sided p-values and encourages a comprehensive understanding of statistical distributions for accurate hypothesis testing.
Takeaways
- 📊 **Understanding P-values**: P-values are calculated to determine the probability that a result occurred by random chance, and they are used to test hypotheses.
- 🔍 **Two Types of P-values**: There are one-sided and two-sided p-values, with two-sided being more common and one-sided being potentially misleading without proper context.
- 🪙 **Null Hypothesis**: In statistics, the null hypothesis (H0) assumes there is no effect or no difference, and a small p-value can lead to its rejection.
- 🎲 **Coin Flipping Example**: The probability of getting heads or tails in a coin flip is used to illustrate how p-values are calculated and interpreted.
- 🤔 **Interpreting P-values**: A typical threshold for rejecting a null hypothesis is a p-value less than 0.05, indicating the result is statistically significant.
- 📈 **Statistical Distributions**: For continuous data like height, statistical distributions are used to calculate probabilities and p-values, as listing every possible outcome is impractical.
- 📉 **Distribution Curves**: The area under a distribution curve represents probabilities, with the mean and standard deviation helping to understand where data points fall in relation to the average.
- 🚫 **Avoiding One-Sided P-values**: One-sided p-values focus only on one direction of change and can be dangerous if not interpreted carefully, as they may not detect negative effects.
- 🧐 **Significance and Direction**: Two-sided p-values detect unusual results in either direction, making them more robust for general hypothesis testing.
- 📚 **Educational Content**: The script is from an educational video series (Stat Quest) aimed at teaching statistical concepts in an accessible way.
- 🌟 **Practical Application**: The script uses real-world examples, such as drug effectiveness, to demonstrate the practical application of p-values in statistical analysis.
Q & A
What is the primary focus of this StatQuest video?
-The primary focus of this StatQuest video is to explain how to calculate p-values, with an emphasis on two-sided p-values, and to discuss their interpretation in the context of statistical hypothesis testing.
Why are one-sided p-values considered potentially dangerous?
-One-sided p-values are considered potentially dangerous because they only consider changes in one direction and can fail to detect changes in the opposite direction, which might be important or even harmful in certain contexts, such as in drug testing.
What is the null hypothesis in the context of the coin flipping example?
-In the context of the coin flipping example, the null hypothesis is that the coin is not special and behaves like a normal coin, despite the observed outcome of two heads in a row.
How is the probability of getting two heads in a row calculated for a fair coin?
-The probability of getting two heads in a row for a fair coin is calculated by considering the independent probabilities of each flip, which is 0.5 (50% chance of heads) multiplied by 0.5 (50% chance of heads again), resulting in a probability of 0.25 (25%).
What does a p-value represent in the context of hypothesis testing?
-A p-value represents the probability of observing the data (or something more extreme) under the assumption that the null hypothesis is true. It is used to decide whether to reject the null hypothesis in favor of the alternative hypothesis.
Why do we consider equally rare outcomes when calculating a two-sided p-value?
-We consider equally rare outcomes when calculating a two-sided p-value to account for the possibility that the observed data could be due to chance, even if it is as rare as the alternative hypothesis. This helps to ensure that we do not reject the null hypothesis solely because of rare chance occurrences.
What is the significance of the p-value threshold of 0.05 in hypothesis testing?
-The p-value threshold of 0.05 is commonly used in hypothesis testing to determine statistical significance. If the p-value is less than 0.05, it suggests that the observed data is unlikely to have occurred by chance under the null hypothesis, and thus the null hypothesis is rejected.
How does the calculation of p-values change when dealing with continuous data like height measurements?
-When dealing with continuous data like height measurements, instead of listing all possible outcomes, we use a statistical distribution to model the data. P-values are then calculated by summing the areas under the curve of the distribution that correspond to the observed data and more extreme values.
What is the difference between a one-sided and a two-sided p-value in the context of a new drug's effectiveness?
-A one-sided p-value considers only the direction of change specified by the researcher (e.g., shorter recovery times), while a two-sided p-value considers both directions (shorter or longer recovery times). A one-sided p-value can be misleading if the drug actually has an effect in the unconsidered direction (e.g., it prolongs recovery time), which is why it should be used with caution.
Why might a researcher choose to use a one-sided p-value instead of a two-sided p-value?
-A researcher might choose to use a one-sided p-value when they have a specific direction of effect in mind that they are interested in detecting. However, this approach can be risky because it may overlook effects in the opposite direction, which could be important or even harmful.
How does the concept of 'more extreme' values relate to the calculation of p-values for continuous data distributions?
-For continuous data distributions, 'more extreme' values are those that are further from the mean of the distribution. When calculating p-values, these more extreme values are added to the p-value to account for the possibility that the observed data could be due to chance variations that are more extreme than the observed data point.
Outlines
📊 Understanding P-Values and Hypothesis Testing
This paragraph introduces the concept of p-values and their role in hypothesis testing. It explains that p-values are calculated by adding up probabilities and are used to determine whether to reject the null hypothesis. The null hypothesis is defined as the assumption that there is no difference between a given coin and a normal coin, and a small p-value would indicate that the coin is special. The paragraph also distinguishes between one-sided and two-sided p-values, noting that the latter is more common and safer to use.
🎲 Calculating P-Values for Coin Tosses
The second paragraph delves into the process of calculating p-values using the example of flipping a coin. It explains how to calculate the probability of getting two heads in a row and how to treat different sequences of heads and tails as the same outcome due to the order not affecting probabilities. The p-value is then calculated by considering the probabilities of equally rare outcomes and more extreme outcomes, leading to a p-value that, if less than 0.05, would lead to the rejection of the null hypothesis. The paragraph emphasizes the difference between the probability of an event and the p-value.
📉 P-Values and Statistical Distributions
This paragraph discusses the calculation of p-values for continuous data, such as height measurements, using statistical distributions. It describes how to use a distribution to find the probability that a person's height falls within a certain range and how to calculate p-values by summing the areas under the curve that represent more extreme values than the observed data. The example of Brazilian women's heights is used to illustrate how p-values can indicate whether data points are unusual in relation to a given distribution.
🔍 Interpreting P-Values with Continuous Data
The fourth paragraph continues the discussion on p-values with continuous data, focusing on how to interpret them. It explains that if a p-value is less than a certain threshold (commonly 0.05), it suggests that the data is unusual and that an alternative distribution might better explain the data. The paragraph uses the example of measuring someone's height to show how p-values can be calculated and interpreted, emphasizing that a p-value close to one indicates that the observed data is not unusual under the given distribution.
⚠️ The Pitfalls of One-Sided P-Values
The final paragraph warns about the potential dangers of one-sided p-values. It contrasts one-sided p-values with two-sided p-values, showing how the former only considers changes in one direction, which can lead to missing important information. The example of a new drug's effectiveness is used to illustrate how a one-sided p-value might fail to detect a negative effect if the drug actually prolongs recovery time. The paragraph advises caution with one-sided p-values and suggests they should only be used by experts.
Mindmap
Keywords
💡P-value
💡Null Hypothesis
💡Two-sided P-value
💡One-sided P-value
💡Statistical Significance
💡Random Chance
💡Coin Flip Experiment
💡Continuous Variable
💡Statistical Distribution
💡Rare Events
💡Significance Threshold
Highlights
Calculating p-values is an essential part of statistical analysis, allowing us to determine the significance of our observations.
P-values are interpreted in the context of a null hypothesis, which assumes that there is no effect or difference.
Two types of p-values exist: one-sided and two-sided, with two-sided being more common and generally preferred.
One-sided p-values are less common and potentially dangerous, as they may lead to incorrect conclusions if not interpreted carefully.
The probability of getting two heads in a row when flipping a fair coin is used as an example to explain p-value calculation.
The p-value is calculated by adding up the probabilities of the observed outcome and all outcomes that are equally rare or more extreme.
In the coin flip example, the p-value for getting two heads is 0.5, which is not less than the typical threshold of 0.05, leading to a failure to reject the null hypothesis.
The concept of statistical significance is introduced, with a common threshold of 0.05 used to determine if the null hypothesis should be rejected.
The difference between the probability of an event and the p-value is clarified, with the p-value considering equally rare or more extreme outcomes.
The importance of considering equally rare or more extreme outcomes when calculating p-values is explained through a flower analogy.
A p-value calculation example is provided for a scenario where a coin lands four heads and one tail in five flips.
The p-value for getting four heads and one tail is calculated to be 0.375, which does not lead to the rejection of the null hypothesis.
Statistical distributions are introduced as a method for calculating probabilities and p-values for continuous data, such as height measurements.
The concept of a one-sided p-value is explained using the example of a new drug's effect on recovery times from an illness.
One-sided p-values are shown to be potentially misleading if the direction of change is not as expected, as they only consider more extreme values in one direction.
The transcript concludes with a summary of the components of a p-value and a caution against the misuse of one-sided p-values.
The importance of understanding p-values for both statistical analysis and practical decision-making is emphasized throughout the transcript.
Transcripts
Browse More Related Video

What are p-values?? Seriously.
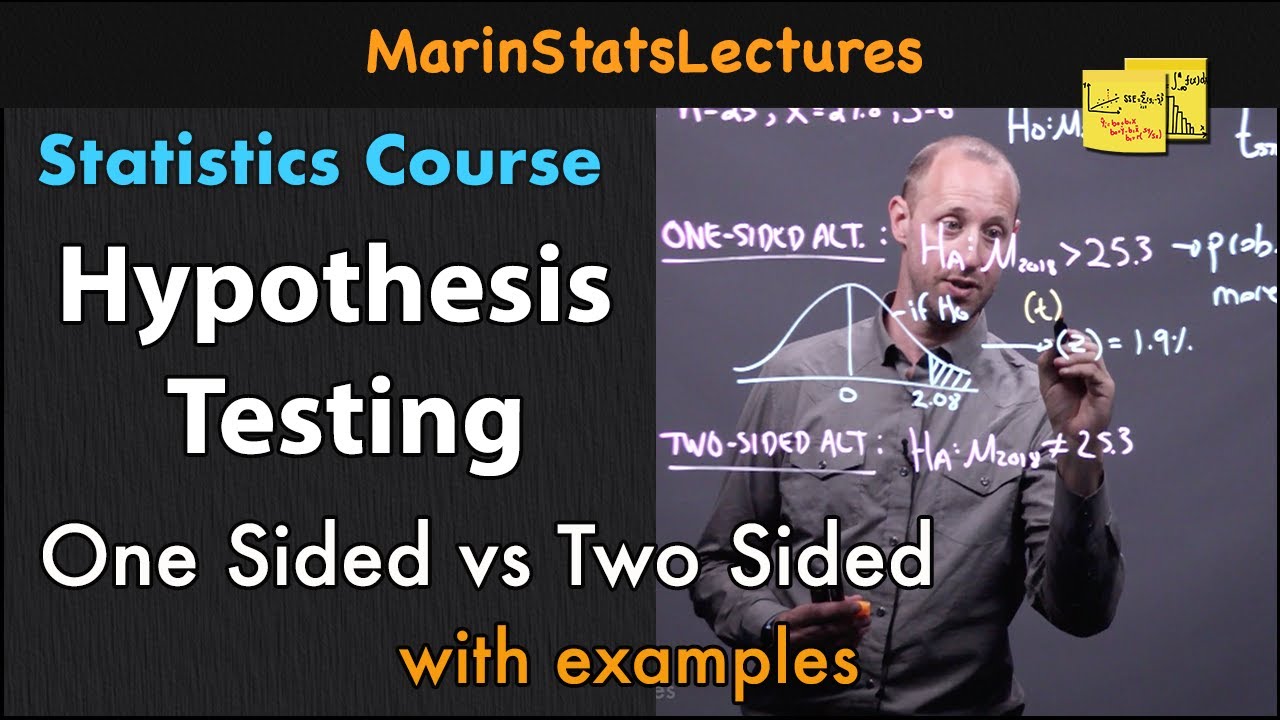
Hypothesis Testing: One Sided vs Two Sided Alternative | Statistics Tutorial #14 |MarinStatsLectures

p-values: What they are and how to interpret them
The basic steps of hypothesis testing
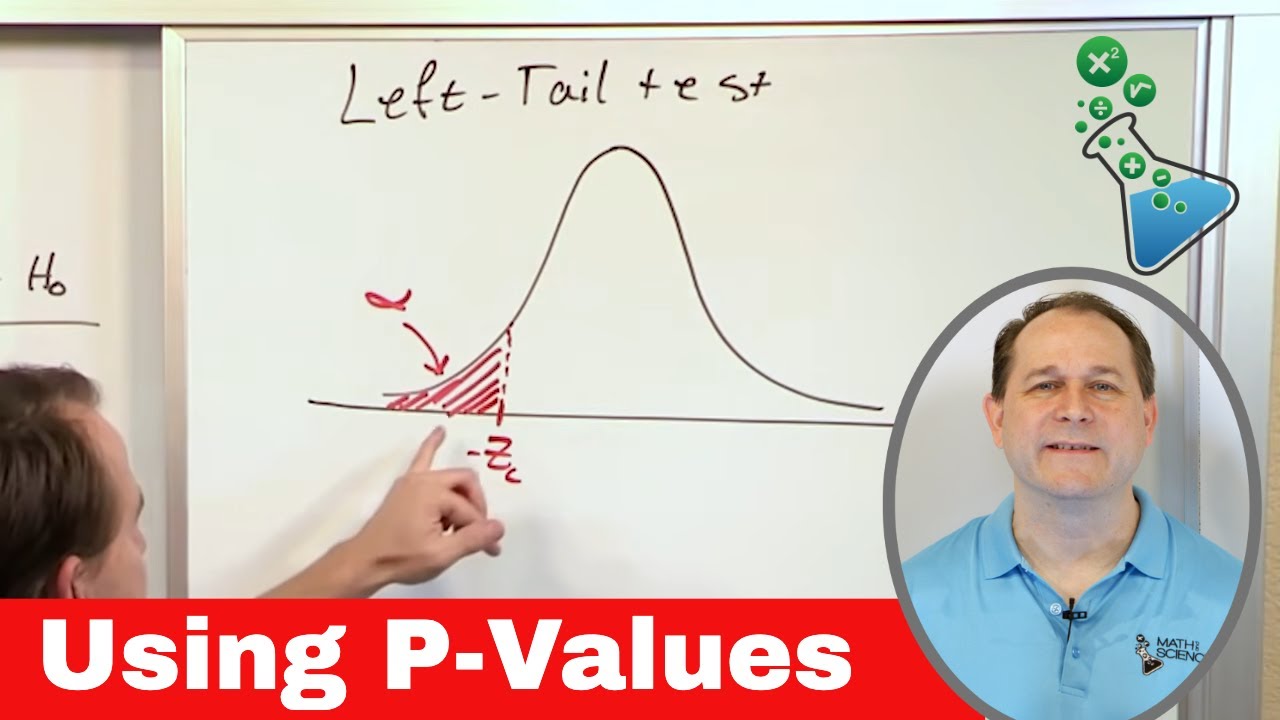
05 - Using P-Values in Hypothesis Testing (Compare P Value to Level of Significance)

What is p-value? How we decide on our confidence level.
5.0 / 5 (0 votes)
Thanks for rating: