Survey Margin of Error: What is it? How does it relate to sample size?
TLDRThis video script delves into the concept of margin of error in surveys, explaining its significance in estimating population opinions from sample data. It clarifies that a margin of error, such as 9.5% for a 95% confidence level, indicates a range within which the true population response is likely to fall. The script also illustrates how overlapping confidence intervals can prevent conclusions about changes in metrics, such as employee engagement scores, between years. It emphasizes the importance of sample size in reducing margin of error for more precise survey results.
Takeaways
- 📊 The margin of error is a measure of the potential error introduced when surveying a sample rather than the entire population.
- 💡 Surveying the whole population is often impractical due to cost, time, and difficulty in obtaining responses from every individual.
- 🔢 The example given uses a population size of 1500, with a sample size of 100, to illustrate the concept of margin of error.
- 🌐 A common confidence level used in surveys is 95%, with some fields like medical trials using 99%.
- 📈 At a 95% confidence level, with a sample of 100 from a 1500 population, the margin of error is calculated to be 9.5%.
- 🔍 This margin of error translates to a range within which the true population percentage lies, in the example, between 15.5% to 34.5%.
- 📉 In HR surveys, such as employee engagement, margin of error is crucial for accurately interpreting changes in scores year over year.
- 🚫 Overlapping ranges of margin of error between years mean you cannot conclusively say that one year's score is higher than the previous.
- 📚 Understanding the impact of sample size on margin of error is important for conducting effective surveys.
- 📉 Larger sample sizes result in a smaller margin of error, allowing for more precise survey results.
- 🛠️ Businesses must decide on an acceptable margin of error and adjust their sample size accordingly to ensure reliable survey outcomes.
Q & A
What is the margin of error in survey sampling?
-The margin of error is a measure of the amount of error introduced when surveying a sample of a population instead of the entire population. It reflects the potential range of error in the results due to the sample not perfectly representing the whole population.
Why is sampling used instead of surveying the whole population?
-Sampling is used because surveying an entire population can be incredibly expensive, time-consuming, and virtually impossible. It allows for more manageable and cost-effective data collection to make informed decisions.
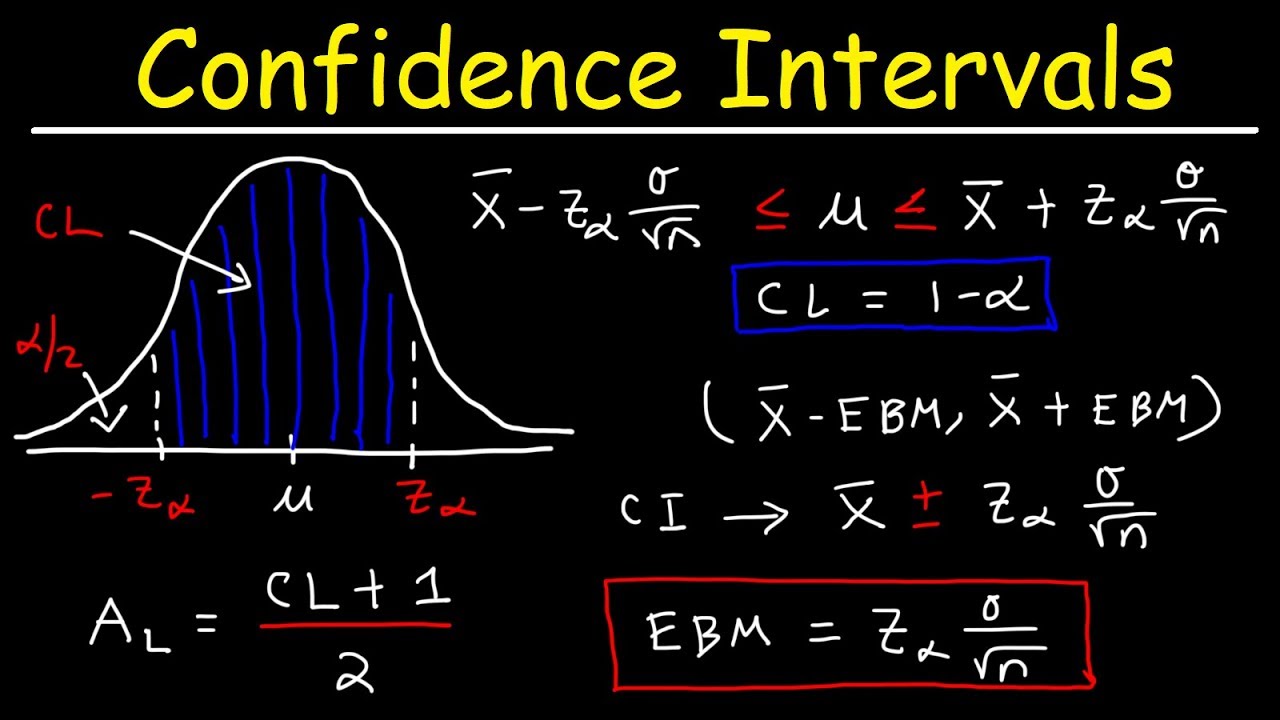
What is the significance of the confidence level in statistical surveys?
-The confidence level, often set at 95% for general business purposes, indicates the level of certainty that the true value lies within the margin of error. It's a key factor in determining the reliability of the survey results.
What does a 95% confidence level mean in the context of a survey?
-A 95% confidence level means that if the survey were repeated multiple times, the true population value would fall within the calculated margin of error 95% of the time.
How does the margin of error relate to the sample size in a survey?
-The margin of error is inversely proportional to the sample size. As the sample size increases, the margin of error decreases, leading to more precise survey results.
What is the formula for calculating the margin of error if not provided in the script?
-The formula for calculating the margin of error is not explicitly provided in the script, but it typically involves the standard deviation of the sample, the sample size, and the desired confidence level.
What does the margin of error of 9.5% imply for a survey with a 95% confidence level?
-A margin of error of 9.5% at a 95% confidence level implies that the true population proportion is estimated to be within 9.5% above or below the sample proportion.
How can the margin of error affect the interpretation of survey results?
-The margin of error affects the interpretation by indicating the range within which the true population value is likely to fall. It helps to understand the potential variability and uncertainty in the survey results.
What is the impact of increasing the sample size on the margin of error?
-Increasing the sample size reduces the margin of error, allowing for a narrower range of possible values for the population parameter, thus increasing the precision of the survey.
Can we conclude that there is an increase in a certain metric just by looking at the increase in the sample percentage?
-No, we cannot conclude an increase in a metric solely by looking at the sample percentage increase. We must consider the margin of error and ensure that the confidence intervals do not overlap to make such a conclusion.
How does the script illustrate the impact of sample size on margin of error?
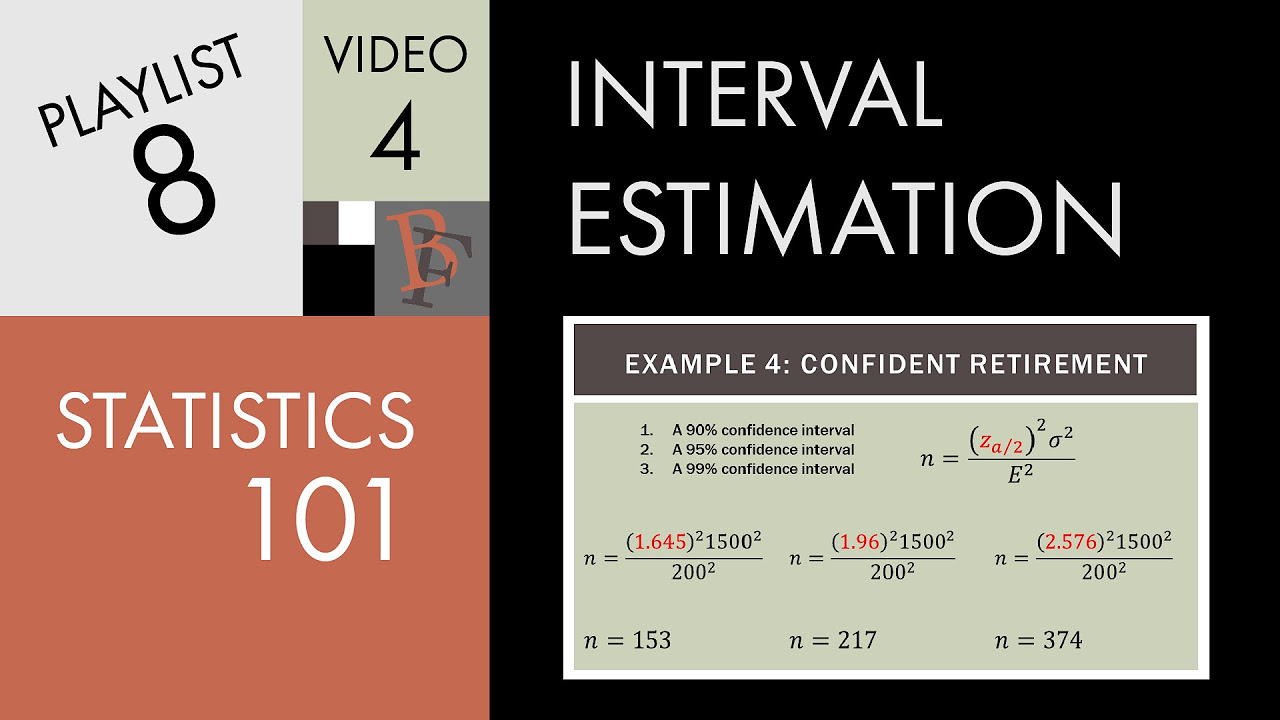
-The script uses an example with different sample sizes ranging from 96 to 2401, showing that as the sample size increases, the margin of error decreases, leading to a more precise estimation of the population parameter.
Outlines
📊 Understanding Margin of Error in Surveys
This paragraph explains the concept of margin of error in statistical surveys. It discusses how the margin of error measures the potential error when a sample of a population is surveyed instead of the entire population. The speaker uses an example with a population size of 1500 and a sample size of 100 to illustrate how a 95% confidence level translates to a margin of error of 9.5%. This means that if 25% of the sample favors a certain issue, the true percentage for the entire population could be anywhere between 15.5% and 34.5%. The paragraph also touches on how this margin of error affects interpretation, as seen in an HR engagement survey example where a margin of error of 5% prevents a definitive conclusion about an increase in engagement scores from one year to the next.
🔍 The Impact of Sample Size on Margin of Error
The second paragraph delves into the relationship between sample size and margin of error. It demonstrates that as the sample size increases, the margin of error decreases, leading to more precise survey results. The speaker provides a visual example comparing different sample sizes and their corresponding margins of error, showing how a larger sample size narrows the range of potential error. The paragraph emphasizes the importance of selecting an appropriate sample size to achieve a desired level of accuracy in survey outcomes. It concludes with a call to action for viewers to engage with the content and explore further resources on data analysis for business improvement.
Mindmap
Keywords
💡Margin of Error
💡Population Size
💡Sample Size
💡Confidence Level
💡Survey
💡Employee Engagement
💡Statistical Significance
💡Data Analysis
💡Business Decision
💡Overlapping Ranges
Highlights
Margin of error is a measure of error introduced in surveys when sampling a population instead of the entire population.
Sampling is used because surveying an entire population is often expensive, time-consuming, and impractical.
A sample size of 100 from a population of 1500 is used to demonstrate the calculation of margin of error.
A 95% confidence level is commonly chosen for surveys, with 99% used in certain circumstances like medical trials.
At a 95% confidence level, sampling 100 people from a population of 1500 results in a margin of error of 9.5%.
The margin of error indicates a range within which the true population response is likely to fall.
For example, if a sample shows 25% favorability, the true population favorability could be between 15.5% and 34.5%.
HR uses engagement surveys to gauge employee sentiment, but the margin of error must be considered in interpreting results.
A margin of error of plus or minus 5% means the true population opinion could range from 86% to 96%.
Overlapping ranges of margin of error from different years do not allow for the conclusion of an increase in scores.
Non-overlapping ranges are necessary to conclude that one year's score is definitively higher than another's.
Increasing the sample size decreases the margin of error, allowing for more precise survey results.
Different sample sizes demonstrate the impact on margin of error, with larger sizes leading to tighter ranges.
A sample size of 100 from 1500 results in a margin of error of 9.5%, which may be too broad for some surveys.
Increasing the sample size to 400 reduces the margin of error to plus or minus 4.2%, offering more precise results.
Business decisions must consider the optimal sample size to achieve an acceptable margin of error.
The video encourages viewers to like, subscribe, and explore more videos on data analysis for business improvement.
Transcripts
Browse More Related Video
How To Find The Z Score, Confidence Interval, and Margin of Error for a Population Mean
Statistics 101: Confidence Intervals, Estimating Sample Size Needed

Confidence Interval for a population proportion | Solved Problems

Confidence intervals and margin of error | AP Statistics | Khan Academy

Math 119 Chap 7 part 1

Margin of Error & Sample Size for Confidence Interval | Statistics Tutorial #11| MarinStatsLectures
5.0 / 5 (0 votes)
Thanks for rating: