Confidence Interval Interpretation. 95% Confidence Interval 90% 99%
TLDRThe video series focuses on helping future physicians study efficiently by concentrating on high-yield material. This particular video discusses confidence intervals, which are crucial for interpreting study results in relation to the overall population. It clarifies a common misconception about the application of confidence intervals, emphasizing that they are used to estimate the population's true value based on study findings, not the study population itself. The video explains that confidence intervals are based on a certain level of confidence, and their width changes with this level. A 95% confidence interval is most common, meaning there's a 95% certainty that the true value lies within a specified range. The width of the interval is also influenced by the sample size; larger samples typically result in narrower intervals. The video further illustrates how confidence intervals are applied to relative risk and odds ratios, noting that these should not cross one, indicating a significant effect. The presenter also cautions against including the value one in these intervals, as it suggests no difference. The video concludes by advising students to focus on higher yield material before delving into less common topics.
Takeaways
- 📊 **Confidence Intervals Explained**: A confidence interval (CI) is a range of values within which the true value of a population parameter is expected to fall, based on study results.
- 🔍 **Misinterpretation Caution**: Common mistake is misapplying confidence intervals to the study population instead of the broader population from which the study sample is drawn.
- 🌟 **High Yield Topic**: Confidence intervals are highly relevant for medical exams, with a high yield rating of 4 out of 10 for Step 1.
- 🏥 **Example Scenario**: If a study of 100 people finds an average BMI of 25, the confidence interval helps estimate the average BMI for a larger population, like a city or county.
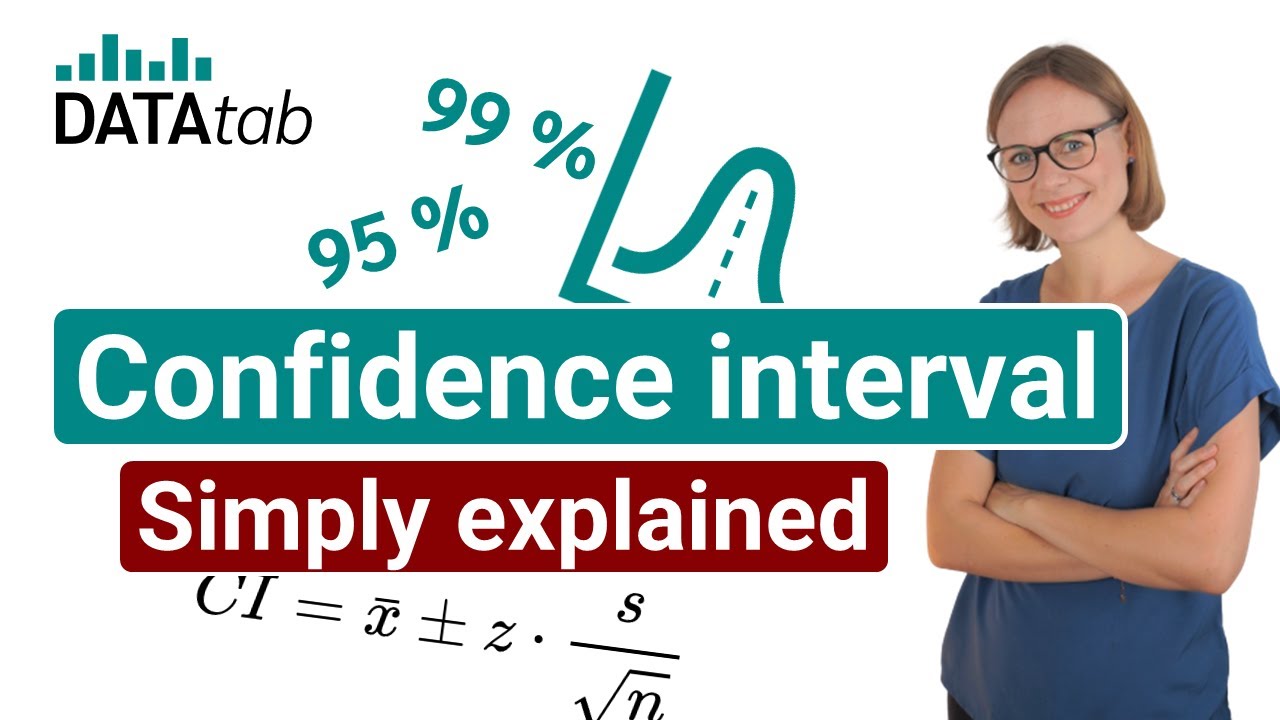
- 📈 **Confidence Level Impact**: The width of the confidence interval changes with the level of confidence; higher confidence levels result in wider intervals.
- 🔢 **Sample Size Effect**: Larger sample sizes generally lead to narrower confidence intervals, similar to how standard deviation decreases with increased sample size.
- 📉 **Statistical Significance**: A statistically significant result means the confidence interval does not include the point of no difference (e.g., 1 for odds ratio or relative risk, 0 for mean differences).
- ⚖️ **Relative Risk and Odds Ratio**: Confidence intervals are often applied to relative risk and odds ratio, and should not cross the point of no difference.
- 🚫 **Avoiding Misinterpretation**: Ensure the confidence interval for relative risk and odds ratio does not include one, indicating a potential lack of effect.
- ➡️ **Extrapolation Principle**: When extrapolating study results to a larger population, apply the confidence interval to estimate the range of the true population value.
- 📝 **Reporting Standards**: When reporting study findings, include not just the point estimate but also the confidence interval to indicate the range of the true population value.
Q & A
What is the main purpose of a confidence interval in statistical analysis?
-The main purpose of a confidence interval is to provide a range of values within which the true value in the population is expected to fall, based on the study results. It helps to estimate the population parameter when the actual value is unknown.
How does the confidence level affect the width of the confidence interval?
-The confidence level directly affects the width of the confidence interval. A higher confidence level means that more values need to be included, resulting in a wider interval. Conversely, a lower confidence level results in a narrower interval.
What is the most common confidence interval used in statistical studies?
-The most common confidence interval used in statistical studies is the 95% confidence interval, which indicates that there is a 95% probability that the true population value lies within the calculated range.
How does the sample size impact the width of the confidence interval?
-The sample size has an inverse relationship with the width of the confidence interval. As the sample size increases, the confidence interval becomes narrower, reflecting a more precise estimate of the population parameter.
Why is it incorrect to apply the confidence interval to the study population itself?
-The confidence interval is not meant to be applied to the study population itself, as it is already represented by the study results. Instead, it is used to extrapolate and estimate the population parameters for a larger group, such as an entire city or county.
What is the significance of the confidence interval not crossing the value of one when dealing with relative risk and odds ratio?
-The value of one represents no difference in relative risk and odds ratio. If the confidence interval does not cross one, it indicates that there is a statistically significant difference between the groups being compared, as the entire interval is either above or below one.
What is the point of no difference when comparing the average of two groups?
-The point of no difference when comparing the average of two groups is zero. This is because it represents the scenario where the averages of the two groups are exactly the same, indicating no difference between them.
What is the importance of not including the value one in the confidence interval for relative risk and odds ratio?
-Including the value one in the confidence interval for relative risk and odds ratio would suggest that there is a possibility of no difference between the groups being compared. To establish statistical significance, the entire confidence interval should be either above one (indicating a higher risk/ratio in the study group) or below one (indicating a lower risk/ratio).
How does the definition of a confidence interval differ from a simple average or mean?
-A confidence interval is a range of values that is used to estimate an unknown population parameter, such as the mean, based on sample data. It provides a level of confidence that the true population parameter lies within this range. In contrast, a simple average or mean is a single value that represents the central tendency of a data set and does not provide any information about the precision or confidence in that estimate.
What are some related topics that the speaker decided not to cover in the video?
-The speaker mentions that there are related topics that they decided not to cover in the video, suggesting that viewers should focus on mastering the higher yield material before delving into these additional topics. However, specific topics are not listed in the transcript.
What is the rating scale used to estimate the importance of each topic for Step 1?
-The rating scale used is from 0 to 10, which provides a rough estimate of how important each topic is for Step 1 of the examination.
Why is it essential to report the confidence interval along with the odds ratio or relative risk in a study?
-Reporting the confidence interval along with the odds ratio or relative risk provides a range within which the true value of the population parameter is likely to lie, indicating the precision of the estimate and allowing for a more comprehensive understanding of the study's findings.
Outlines
📊 Understanding Confidence Intervals in Medical Studies
This paragraph delves into the concept of confidence intervals, which are crucial for interpreting study results in the context of a larger population. The speaker clarifies a common misconception about the application of confidence intervals, emphasizing that they are not about the study population itself but about extrapolating findings to a broader population. The importance of the confidence level is highlighted, with examples given for 95%, 90%, and 99% confidence intervals and how they affect the width of the interval. The influence of sample size on the interval's width is also discussed, noting that larger samples typically result in narrower intervals. The paragraph concludes with the application of confidence intervals to relative risk and odds ratio, stressing the significance of the interval not crossing the value of one, indicating a true effect.
🔍 Statistical Significance and Confidence Intervals for Risk and Ratio
The second paragraph focuses on the application of confidence intervals to relative risk and odds ratio, highlighting that these measures should not include the value one, as it would suggest no difference between compared groups. The speaker provides a clear explanation of the point of no difference for both relative risk and odds ratio, which is one, and contrasts this with the comparison of averages between two groups, where the point of no difference is zero. Using the example of a study with a relative risk measurement, the paragraph illustrates how a statistically significant result is one where the confidence interval does not include one, indicating a clear effect. Conversely, if the interval does include one, as in the example with a 95% confidence interval ranging from 0.9 to 2.1, the result is not statistically significant, suggesting there's a possibility of no effect. The paragraph ends with a note on related topics that are not covered in the video and an invitation for viewers to point out any mistakes or typos.
Mindmap
Keywords
💡Confidence Interval
💡High Yield Material
💡Population
💡Sample Size
💡Relative Risk
💡Odds Ratio
💡Statistical Significance
💡Systolic Blood Pressure
💡BMI (Body Mass Index)
💡Level of Confidence
💡Standard Deviation
Highlights
Confidence intervals are used to estimate the range of values that the true value in a population is expected to fall within based on study results.
A common mistake is thinking that the confidence interval applies to the study population, when it actually helps extrapolate to a larger population.
The confidence interval is based on a certain level of confidence, which affects its width; a higher level of confidence results in a wider interval.
The 95% confidence interval is the most common, indicating a 95% certainty that the actual value lies within the interval.
The width of the confidence interval can be influenced by the sample size; larger sample sizes typically result in narrower intervals.
Confidence intervals are also applied to relative risk and odds ratios, providing a range where the true population value is likely to lie.
For odds ratios and relative risks, the confidence interval should not cross one, as this would suggest no difference.
When comparing the average of two groups, the point of no difference is zero, and the confidence interval should not include zero for statistical significance.
Statistical significance is determined by whether the confidence interval includes the value representing no difference (e.g., 1 for relative risk or odds ratio, 0 for averages).
The presenter emphasizes that the confidence interval is a crucial concept for future physicians to understand when interpreting study results.
The video provides an example of how confidence intervals are calculated and interpreted for systolic blood pressure measurements.
Different confidence levels such as 90% and 99% can be used, each resulting in a different width of the confidence interval.
The importance of the confidence interval is rated highly for its relevance to Step 1 of medical licensing exams.
The presenter is a medical student sharing knowledge to help fellow students, inviting corrections and feedback for accuracy.
The video concludes with a reminder that the presenter is not an expert, but rather a peer trying to assist in the learning process.
The video is part of a free video series aimed at studying efficiently by focusing on high-yield material for medical exams.
The presenter encourages viewers to visit their website for more information on the importance of different topics for Step 1.
Transcripts
Browse More Related Video

Confidence Interval for a population proportion | Solved Problems
Confidence Interval [Simply explained]

Hypothesis Test vs. Confidence Interval | Statistics Tutorial #15 | MarinStatsLectures

Confidence Intervals: Crash Course Statistics #20
Statistics 101: Confidence Interval Estimation, Sigma Known
How To Find The Z Score, Confidence Interval, and Margin of Error for a Population Mean
5.0 / 5 (0 votes)
Thanks for rating: