Graphing Quadratic Functions In Standard Form Using X & Y Intercepts | Algebra
TLDRThis educational video script focuses on graphing quadratic functions in standard form, offering a step-by-step guide. It begins by determining the vertex using the formula -b/(2a), identifying the x-intercepts through factoring, and finding the y-intercept by setting x to zero. The script illustrates the process of plotting these points and graphing the function, highlighting the axis of symmetry and the function's range and domain. The example provided walks through the calculations for a specific quadratic equation, demonstrating how to find key points and graph the parabola, ensuring a clear understanding of the concepts.
Takeaways
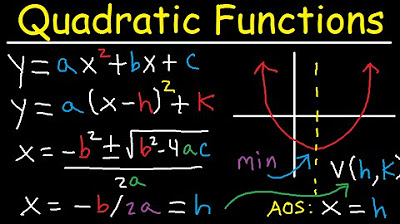
- 📚 The lesson focuses on graphing quadratic functions in standard form, which is (ax^2 + bx + c).
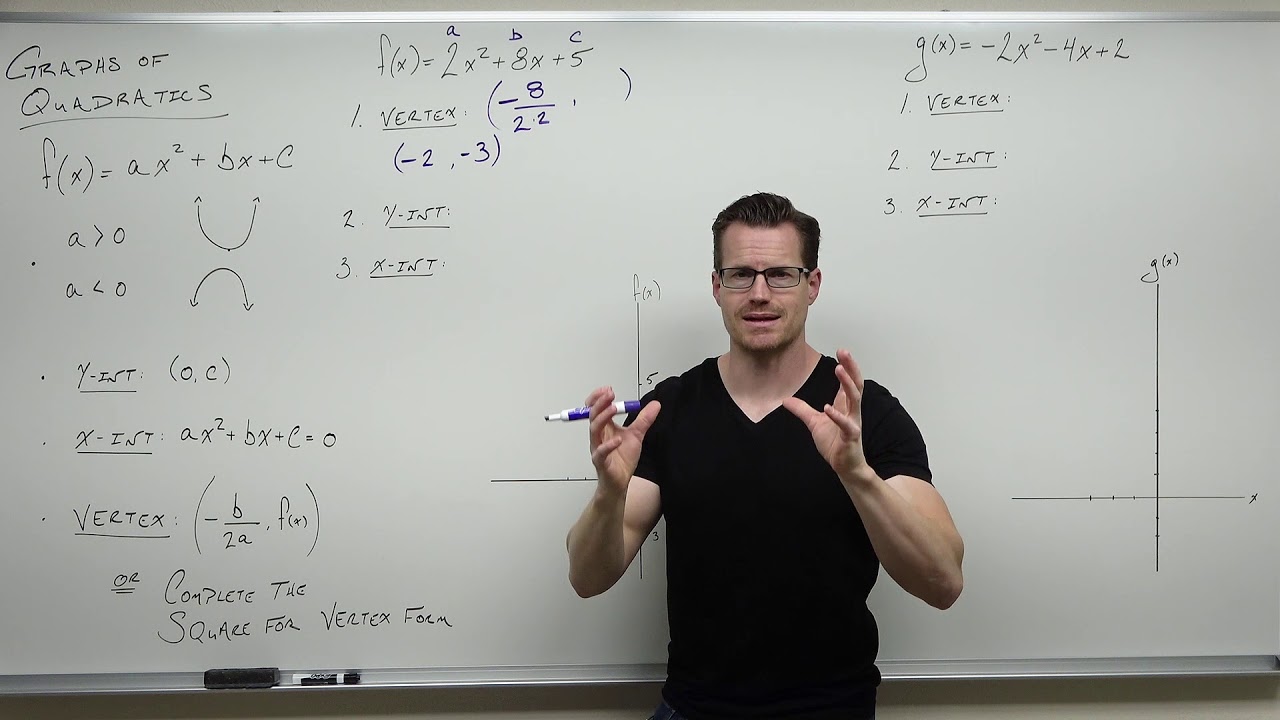
- 📈 The vertex of a quadratic function is calculated using the formula (-b/2a).
- 🔍 To find the vertex, the script identifies 'a' as the coefficient of (x^2) and 'b' as the coefficient of 'x'.
- 📝 The vertex in the example has an x-value of 2, calculated as (-(-4)/(2 * 1)).
- 🧭 The y-value of the vertex is found by substituting x = 2 into the quadratic equation, resulting in -1.
- 🔑 To find x-intercepts, the script sets y to zero and factors the quadratic equation to find the roots.
- 📍 The x-intercepts for the example are x = 1 and x = 3, which are points where the graph crosses the x-axis.
- 📊 The y-intercept is found by setting x to zero in the equation, yielding a y-value of 3.
- 📈 The graph's axis of symmetry is the vertical line through the vertex, x = 2.
- 📉 The minimum value of the function is the y-value of the vertex, which is -1 in the example.
- 🌐 The range of the function is from the minimum value to infinity, and the domain is all real numbers.
Q & A
What is the first step when graphing a quadratic function in standard form?
-The first step is to find the vertex of the quadratic function.
How do you find the vertex of a quadratic function in standard form?
-The vertex can be found using the formula x = -b/(2a), where 'a' is the coefficient of x² and 'b' is the coefficient of x.
What are the values of 'a' and 'b' in the given example?
-'a' is 1 and 'b' is -4 in the given quadratic function example.
What is the x-value of the vertex for the given quadratic function?
-The x-value of the vertex is 2, calculated as -(-4)/(2*1) = 4/2 = 2.
How is the y-value of the vertex calculated in the example?
-The y-value of the vertex is calculated by substituting x = 2 into the quadratic function: 2² - 4*2 + 3 = 4 - 8 + 3 = -1.
What are the x-intercepts of the quadratic function?
-The x-intercepts are the points where y equals zero. In the example, the x-intercepts are 1 and 3.
How do you determine the x-intercepts from the quadratic function?
-The x-intercepts are found by setting y to zero and factoring the quadratic equation: x² - 4x + 3 = 0, which factors to (x-1)(x-3) = 0, giving x = 1 and x = 3.
What is the y-intercept of the quadratic function in the example?
-The y-intercept is 3, which is found by substituting x = 0 into the quadratic function: 0² - 4*0 + 3 = 3.
Why is it important to find the y-intercept and the x-intercepts when graphing a quadratic function?
-Finding the y-intercept and x-intercepts helps in plotting key points on the graph, which makes it easier to draw the shape of the quadratic function accurately.
What is the axis of symmetry for the quadratic function in the example?
-The axis of symmetry is the vertical line that passes through the vertex, which is x = 2.
What is the minimum value of the quadratic function in the example and how is it determined?
-The minimum value is -1, which is the y-value of the vertex.
What are the domain and range of the quadratic function in the example?
-The domain of the quadratic function is all real numbers, and the range is from -1 to infinity.
Outlines
📚 Graphing Quadratic Functions in Standard Form
This paragraph introduces the process of graphing quadratic functions in standard form, which is expressed as \( ax^2 + bx + c \). The video script explains the importance of using a data table to organize information such as the vertex and intercepts. The vertex is calculated using the formula \( -\frac{b}{2a} \), and in this example, with \( a = 1 \) and \( b = -4 \), it is found to be at \( x = 2 \). The y-value of the vertex is determined by substituting \( x = 2 \) into the quadratic equation, resulting in \( y = -1 \). The x-intercepts are found by setting \( y = 0 \) and factoring the equation, leading to the solutions \( x = 1 \) and \( x = 3 \). The y-intercept is found by setting \( x = 0 \), yielding a value of 3. The script also discusses the symmetry of the graph around the vertex and the minimum value of the function, which is \( y = -1 \) in this case. The domain of the function is all real numbers, and the range is from \( y = -1 \) to infinity. The paragraph concludes with the steps to plot the graph, including the axis of symmetry and the points where the curve touches the x and y axes.
Mindmap
Keywords
💡Quadratic functions
💡Standard form
💡Vertex
💡x-intercept
💡y-intercept
💡Data table
💡Axis of symmetry
💡Domain
💡Range
💡Graphing
Highlights
Introduction to graphing quadratic functions in standard form.
Use of a data table for organizing information.
Finding the vertex of the parabola using the formula -b/2a.
Calculation of the vertex's x-value as 2.
Determining the y-value of the vertex when x is 2.
Vertex coordinates identified as (2, -1).
Method to find x-intercepts by setting y to zero.
Factoring to find x-intercepts: x = 1 and x = 3.
Identification of points where the curve touches the x-axis.
Finding the y-intercept by substituting x with zero.
Y-intercept point determined as (0, 3).
Understanding the symmetry of the parabola around the vertex.
Graphing the function with identified vertex and intercepts.
Plotting the x-intercepts at (1, 0) and (3, 0).
Plotting the y-intercept at (0, 3).
Drawing the axis of symmetry as x = 2.
Identifying the minimum value of the function as -1.
Describing the range of the function from -1 to infinity.
Confirming the domain of the function as all real numbers.
Conclusion of the graphing process for standard form functions.
Transcripts
Browse More Related Video
Graphing Quadratic Functions in Vertex & Standard Form - Axis of Symmetry - Word Problems
Graphing Quadratic Functions In Vertex Form
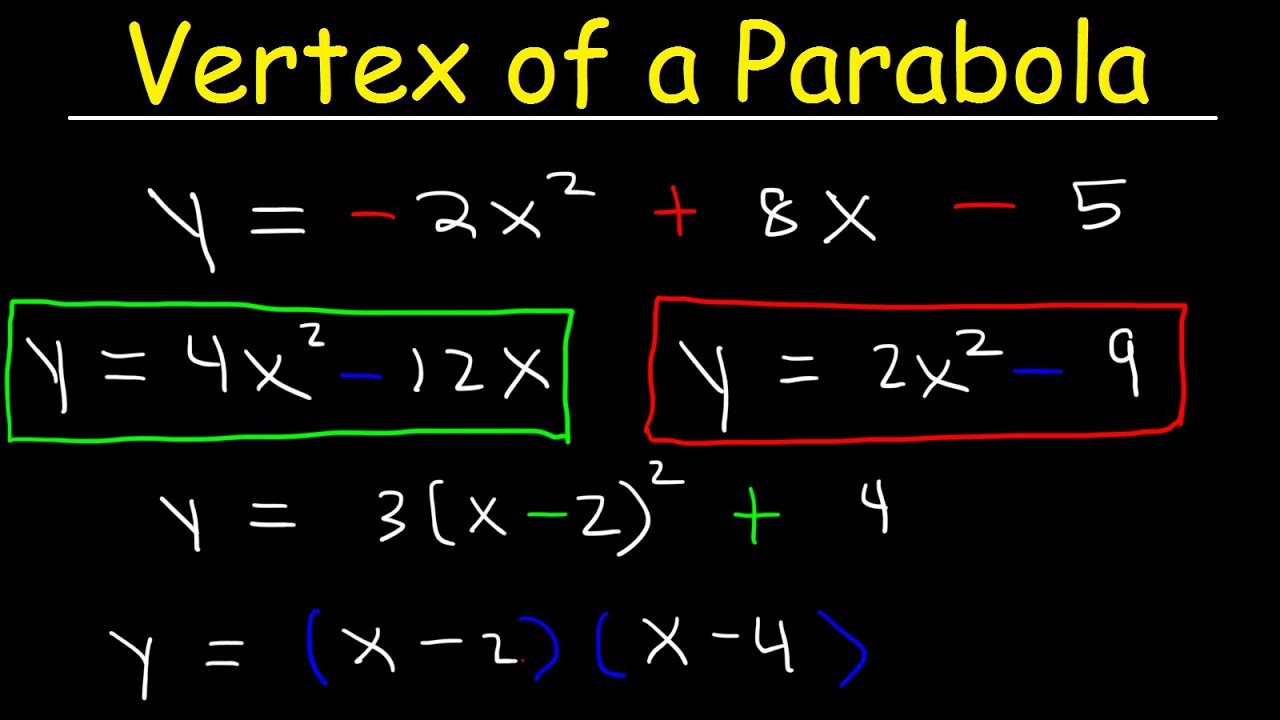
How To Find The Vertex of a Parabola - Standard Form, Factored & Vertex Form
Graphing Quadratic Functions (Precalculus - College Algebra 24)

Graphing Quadratic Functions Using a Data Table | Algebra
Business Calculus - Section 1.2 - Graphs of Functions
5.0 / 5 (0 votes)
Thanks for rating: