Graphing Quadratic Functions In Vertex Form
TLDRThis lesson focuses on graphing quadratic functions in vertex form without a data table. It begins with the example of x - 2 squared minus 3, illustrating how to find the vertex, plot it, and determine the domain, range, and axis of symmetry. The instructor explains the process of graphing by using the parent function and adjusting for the 'a' value, which affects the width and direction of the parabola. The lesson includes multiple examples, each demonstrating how to find the vertex, graph the function, and identify key characteristics such as the domain, range, and extremum values.
Takeaways
- 📚 The lesson focuses on graphing quadratic functions in vertex form without using a data table.
- 📍 The vertex of a quadratic function can be identified directly from its vertex form equation.
- 📈 The vertex coordinates are plotted on the graph to establish the starting point for the function's graph.
- 🔍 The parent function \( y = x^2 \) is used as a reference to determine how the graph of the given quadratic function will differ.
- ↔️ The graph is extended by considering the effect of moving one or two units to the right or left of the vertex.
- 📉 For upward-opening parabolas, the next point above the vertex is found by moving up by the square of the distance from the vertex.
- 📈 The domain of a quadratic function is all real numbers, from negative infinity to infinity.
- 📊 The range of the function is determined by the vertex's y-coordinate and whether the parabola opens upward or downward.
- 📏 The axis of symmetry is the x-coordinate of the vertex, which divides the parabola into two mirror-image halves.
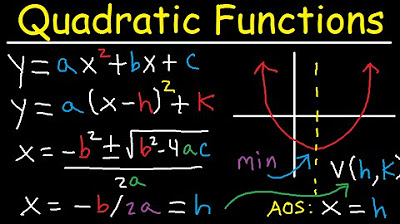
- 🔑 The vertex form of a quadratic function is \( y = a(x - h)^2 + k \), where \( (h, k) \) is the vertex.
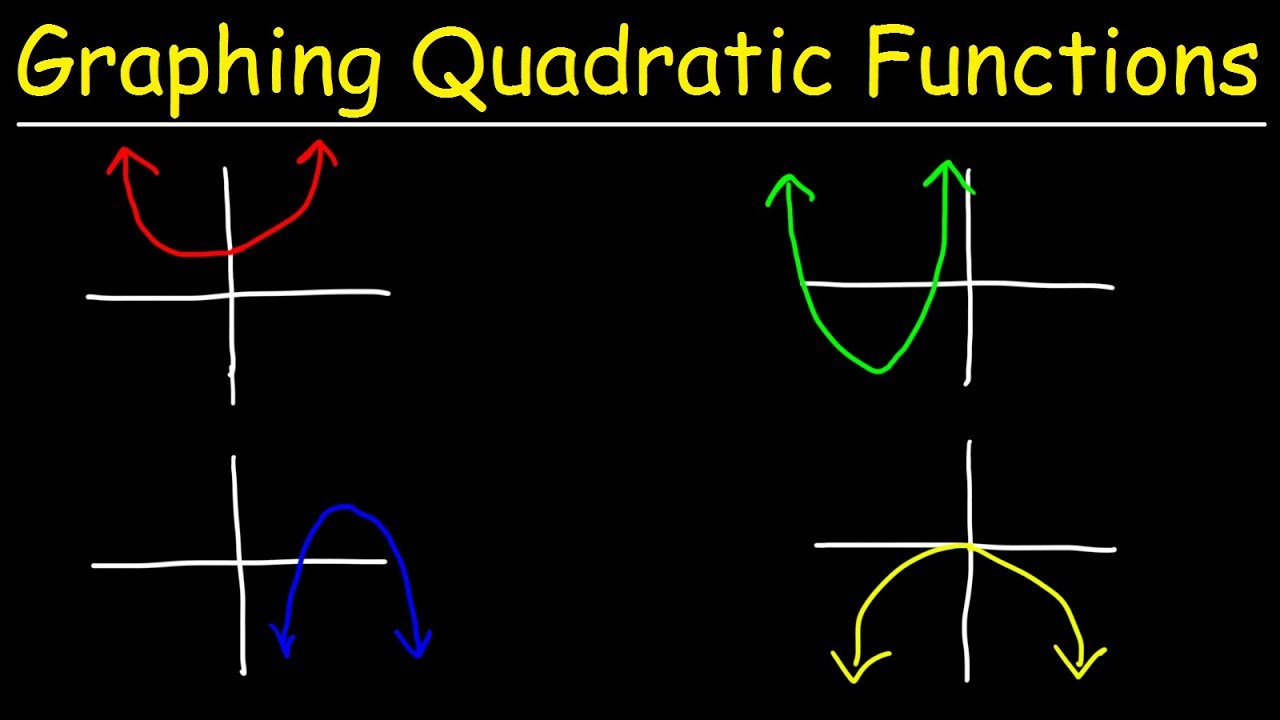
- ⏫⏬ The value of 'a' affects the width and direction of the parabola; a larger 'a' makes the graph narrower and more vertically stretched.
Q & A
What is the main topic of the lesson?
-The main topic of the lesson is graphing quadratic functions in vertex form without using a data table.
What is the first step in graphing a quadratic function in vertex form?
-The first step is to find the vertex of the quadratic function.
How is the vertex of the quadratic function 'x - 2 squared minus 3' determined?
-The vertex is determined by looking at the expression 'x - 2 squared' which indicates the vertex is at (2, -3).
What is the parent function referred to in the script?
-The parent function referred to is 'y = x squared', which is the basic form of a quadratic function.
How does the script suggest finding the next point after plotting the vertex?
-The script suggests using the parent function to find the next point by moving one unit to the right or left and adjusting the y-value accordingly.
What is the domain of a quadratic function graphed in the script?
-The domain of a quadratic function is all real numbers from negative infinity to infinity.
How is the range of the quadratic function determined?
-The range is determined by the lowest and highest y-values of the graph, including the minimum or maximum value at the vertex.
What is the axis of symmetry for a quadratic function?
-The axis of symmetry is the x-coordinate of the vertex of the quadratic function.
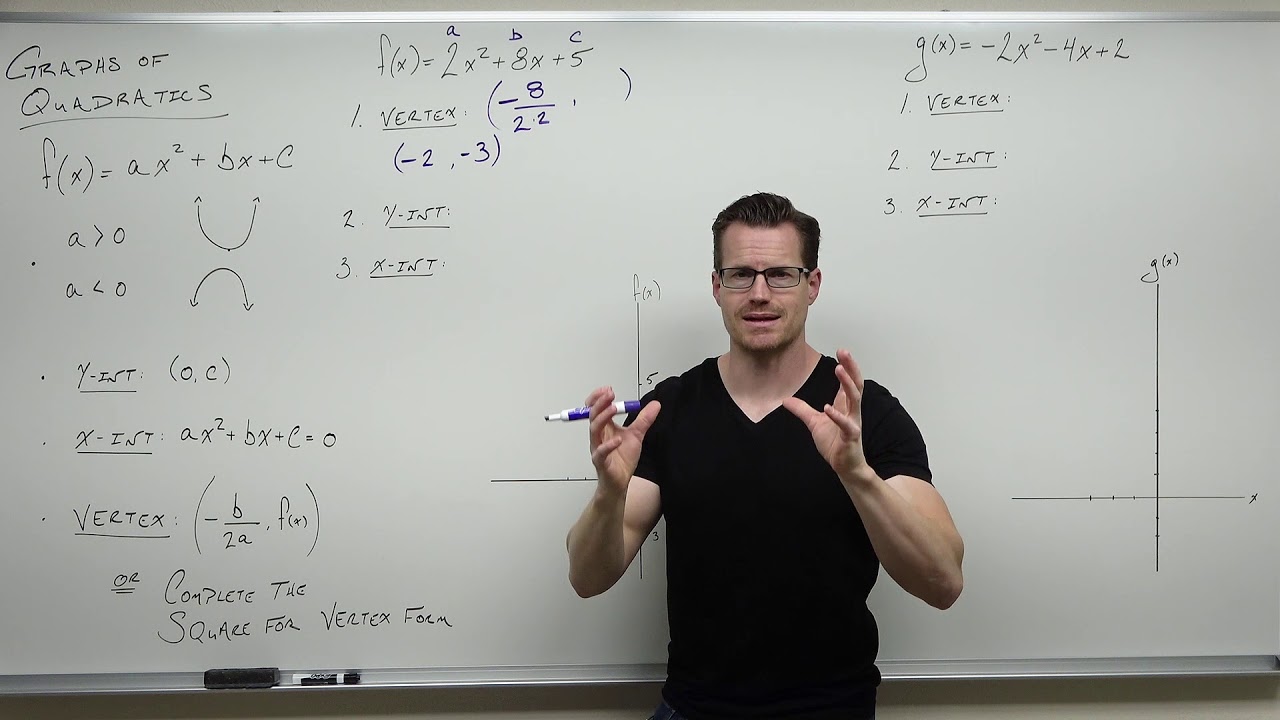
How does the coefficient 'a' in front of the squared term affect the graph of a quadratic function?
-The coefficient 'a' affects the width and vertical stretch of the graph. A larger absolute value of 'a' makes the graph narrower and more vertically stretched.
What is the significance of the vertex in determining the minimum or maximum value of a quadratic function?
-The vertex holds the minimum or maximum value of the quadratic function, depending on whether the parabola opens upward or downward.
How does the script handle a quadratic function that opens downward?
-The script adjusts the graph to show that the function has a maximum value at the vertex, and the y-values decrease as x moves away from the vertex.
Outlines
📈 Graphing Quadratic Functions in Vertex Form
This paragraph explains the process of graphing quadratic functions in vertex form without using a data table. It begins with an example of the function \(x - 2\) squared minus 3, where the vertex is identified as (2, -3). The explanation includes plotting the vertex, understanding the parent function \(y = x^2\), and using the vertex to determine subsequent points on the graph. The domain is all real numbers, and the range is from the lowest \(y\) value of -3 to infinity. The axis of symmetry is the \(x\)-coordinate of the vertex, and since the graph opens upward, the minimum value is -3. Another example, \(-2(x + 1)^2 - 5\), is also discussed, with the vertex at (-1, -5), and the axis of symmetry as \(x = -1\). The process of graphing involves adjusting for the coefficient in front of the squared term, which affects the steepness and direction of the parabola.
📊 Understanding Vertex Form with Different Coefficients
The second paragraph delves into graphing a quadratic function with a different coefficient, \(-3(x - 1)^2 + 9\), and emphasizes that most of the graph will be above the x-axis. The vertex is at (1, 9), and the function's behavior is explained by the negative coefficient in front of the squared term, which causes the graph to open downward. As the value of \(x\) increases or decreases from the vertex, the \(y\) value decreases by multiples of the coefficient. This results in points such as (2, 6) and (0, 6) for one unit movement and (-3, -3) and (-1, -3) for two units movement. The domain remains all real numbers, but the range is from negative infinity to 9, reflecting the downward opening of the parabola. The axis of symmetry is \(x = 1\), and the maximum value, found at the vertex, is 9.
Mindmap
Keywords
💡Graphing
💡Quadratic Functions
💡Vertex Form
💡Vertex
💡Axis of Symmetry
💡Domain
💡Range
💡Minimum/Maximum Value
💡Data Table
💡Parent Function
Highlights
Lesson focuses on graphing quadratic functions in vertex form without a data table.
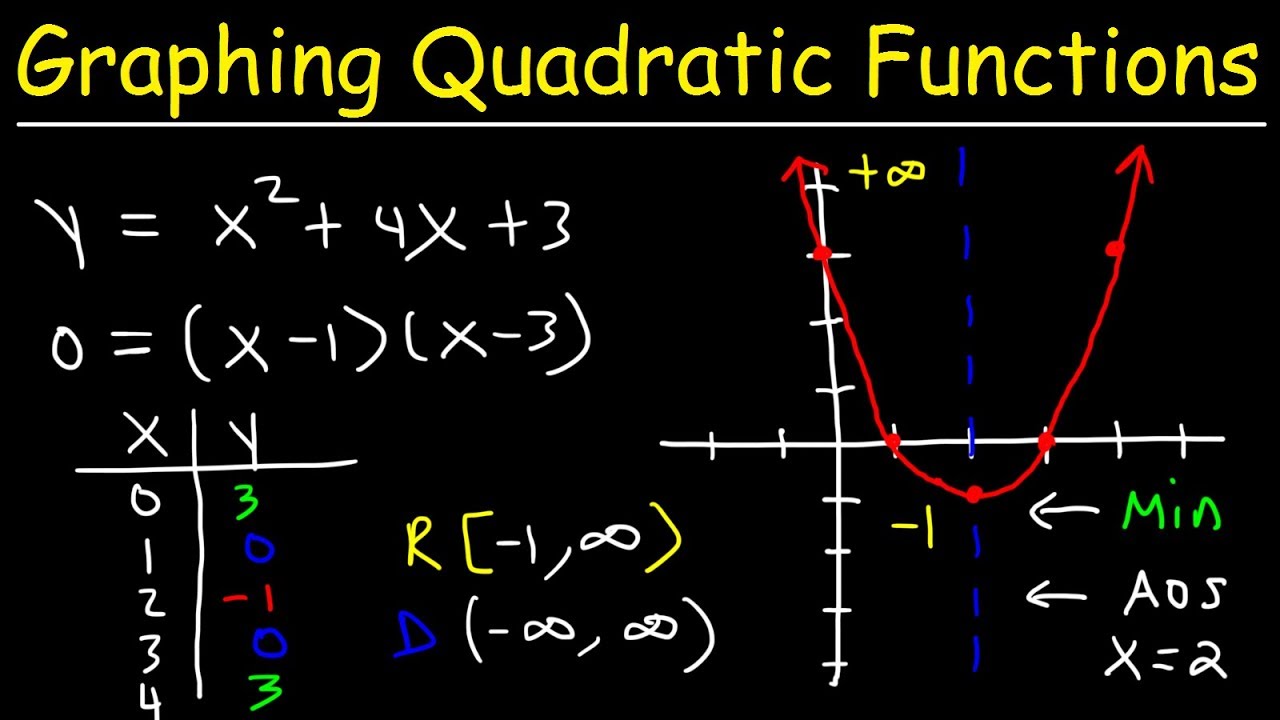
Example given: graphing the function (x - 2)^2 - 3.
Vertex identification for the function is (2, -3).
Plotting the vertex two units right and three down from the origin.
Parent function is y = x^2, used to find subsequent points on the graph.
Rule for finding points: moving one unit right or left and up one unit.
Identifying points (1, -2) and (-1, -2) based on the rule.
Further points found by moving two units right or left and up four units.
Graphing the function with domain all real numbers and range from -3 to infinity.
Axis of symmetry is the x-coordinate of the vertex, x = 2.
Second example: graphing -2(x + 1)^2 - 5 with vertex (-1, -5).
Adjusting the function to open upward by changing -2 to +2.
Parent function is 2x^2, affecting the rate of change on the graph.
Finding points by moving one unit right or left and up two units.
Graphing with domain all real numbers and range from -5 to infinity.
Axis of symmetry is x = -1 for the second example.
Third example: graphing -3(x - 1)^2 + 9 with vertex (1, 9).
Graph's majority above x-axis due to vertex position.
Rule for finding points: moving one unit right or left and down three units.
Identifying points (2, 6), (0, 6), (3, -3), and (-1, -3).
Graphing with domain all real numbers and range from -∞ to 9.
Axis of symmetry is x = 1 for the third example.
Maximum value found at the vertex for downward-opening parabolas.
Transcripts
Browse More Related Video

Graphing Quadratic Functions Using a Data Table | Algebra
Graphing Quadratic Functions In Standard Form Using X & Y Intercepts | Algebra
Graphing Quadratic Functions in Vertex & Standard Form - Axis of Symmetry - Word Problems
Graphing Quadratic Functions Using Transformations
Graphing Quadratic Functions (Precalculus - College Algebra 24)
How To Graph Exponential Functions
5.0 / 5 (0 votes)
Thanks for rating: