Graphing Quadratic Functions Using a Data Table | Algebra
TLDRThis video script teaches graphing quadratic functions using a table, starting with the basic form y=x^2 and explaining how to find the vertex and domain. It then covers vertex form, y=a(x-h)^2+k, and uses examples to illustrate plotting points and finding the axis of symmetry. The lesson emphasizes understanding the domain, range, and symmetry of quadratic graphs, and how to identify maximum and minimum values based on the graph's direction.
Takeaways
- 📈 The vertex of a quadratic function (y = x^2) is at the origin (0, 0).
- 🔍 To graph a quadratic function, choose points symmetrically around the vertex, with equal y-values for points equidistant from the vertex.
- 🌟 The domain of a quadratic function is all real numbers, from negative infinity to infinity.
- 🚀 The range of a quadratic function (y = x^2) is from zero to infinity, including zero.
- 💹 The axis of symmetry for a quadratic function is the x-coordinate of the vertex, represented as (x = h) in vertex form.
- 📊 The minimum value of a quadratic function that opens upwards is the y-coordinate of the vertex.
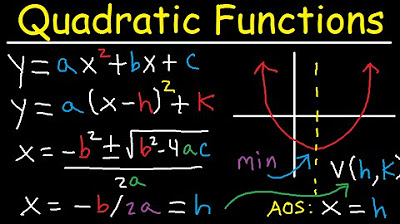
- 🔧 In vertex form, a quadratic function is represented as (y = a(x - h)^2 + k), where (h) and (k) are the coordinates of the vertex.
- 🔄 For vertex form, change the sign of the coefficient of the (x) term to find the axis of symmetry if it's not already in standard form.
- 📈 The vertex of a quadratic function can be found using the formula (x = -b/2a) for standard form, where (a) is the coefficient of (x^2) and (b) is the coefficient of (x).
- 📉 For a quadratic function that opens downwards, the maximum value is the y-coordinate of the vertex.
- 📌 The graph of a quadratic function in standard form (y = -x^2 + 4x + 1) has a vertex at (2, 5), a domain of all real numbers, a range from negative infinity to 5, and an axis of symmetry at (x = 2).
Q & A
What is the vertex of the graph for the quadratic function y = x^2?
-The vertex of the graph for the quadratic function y = x^2 is at the origin, which is (0, 0).
How do you determine the domain of a quadratic function?
-The domain of a quadratic function includes all possible x-values, which means it ranges from negative infinity to infinity and consists of all real numbers.
What is the range of the quadratic function y = x^2?
-The range of the quadratic function y = x^2 includes all y-values from zero to positive infinity, including zero but not including negative infinity, represented as [0, ∞).
How can you find the axis of symmetry for a quadratic function?
-The axis of symmetry for a quadratic function is a vertical line that passes through the vertex. It can be found by using the x-coordinate of the vertex, expressed as x = h, where h is the x-coordinate of the vertex.
What is the vertex form of a quadratic function?
-The vertex form of a quadratic function is expressed as y = a(x - h)^2 + k, where (h, k) represents the coordinates of the vertex.
How do you identify the minimum or maximum value of a quadratic function?
-For a quadratic function that opens upward, the minimum value is the y-coordinate of the vertex. If the graph opens downward, the maximum value is the y-coordinate of the vertex.
What is the standard form of a quadratic function?
-The standard form of a quadratic function is expressed as y = ax^2 + bx + c, where a, b, and c are constants and 'a' is not equal to zero.
How do you convert a quadratic function from standard form to vertex form?
-To convert a quadratic function from standard form to vertex form, complete the square by rearranging the terms to isolate the x-variable, resulting in the form y = a(x - h)^2 + k, where (h, k) is the vertex of the parabola.
What is the x-coordinate of the vertex for the given quadratic function y = -x^2 + 4x + 1?
-The x-coordinate of the vertex for the quadratic function y = -x^2 + 4x + 1 is found using the formula -b/(2a). Here, a = -1 and b = 4, so the x-coordinate is -4/(2*-1), which simplifies to 2.
How do you determine the y-coordinates of points on the graph of y = x^2 using the vertex and the points equidistant from it?
-For the quadratic function y = x^2, if you have the vertex and know the x-value of a point, you can find the corresponding y-value by squaring the x-value. For points equidistant from the vertex on either side, the y-values will be the same due to symmetry. For example, (1, 1) and (-1, 1) are both on the graph because 1^2 = (-1)^2 = 1.
What is the range of the quadratic function y = -x^2 + 4x + 1?
-The range of the quadratic function y = -x^2 + 4x + 1 includes all y-values from the minimum value, which is the y-coordinate of the vertex, to positive infinity. The vertex is at (2, 5), so the range is from 5 to positive infinity, including 5, represented as [5, ∞).
Outlines
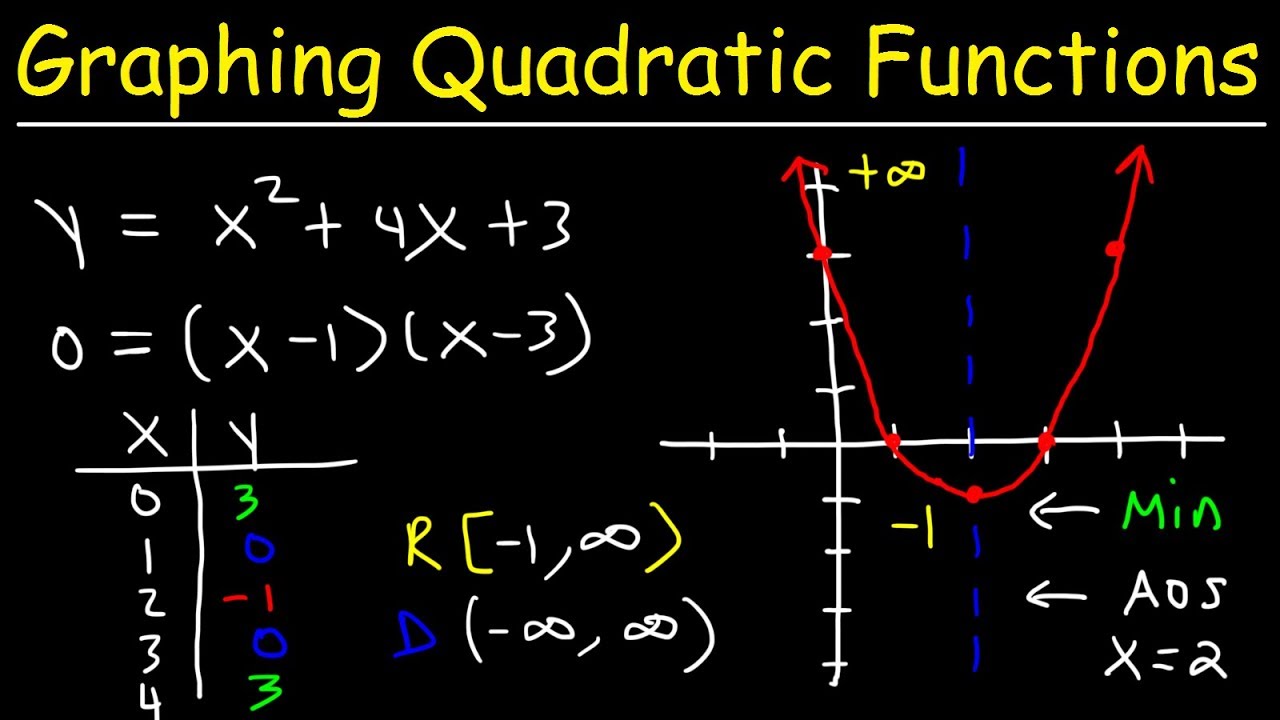
📊 Graphing Quadratic Functions in Standard Form
This paragraph explains the process of graphing quadratic functions in standard form, which is y = x^2. It begins by identifying the vertex of the graph, located at the origin (0,0), and then describes selecting two points to the right and two to the left of the vertex to plot the graph. The distances from these points to the vertex are equal, resulting in the same y-values for symmetric points. The paragraph further discusses the domain and range of the function, noting that the domain is all real numbers from negative infinity to infinity, and the range is from zero to infinity, including zero. The axis of symmetry is also identified as x = 0, and the vertex's y-coordinate is recognized as the minimum value of the function.
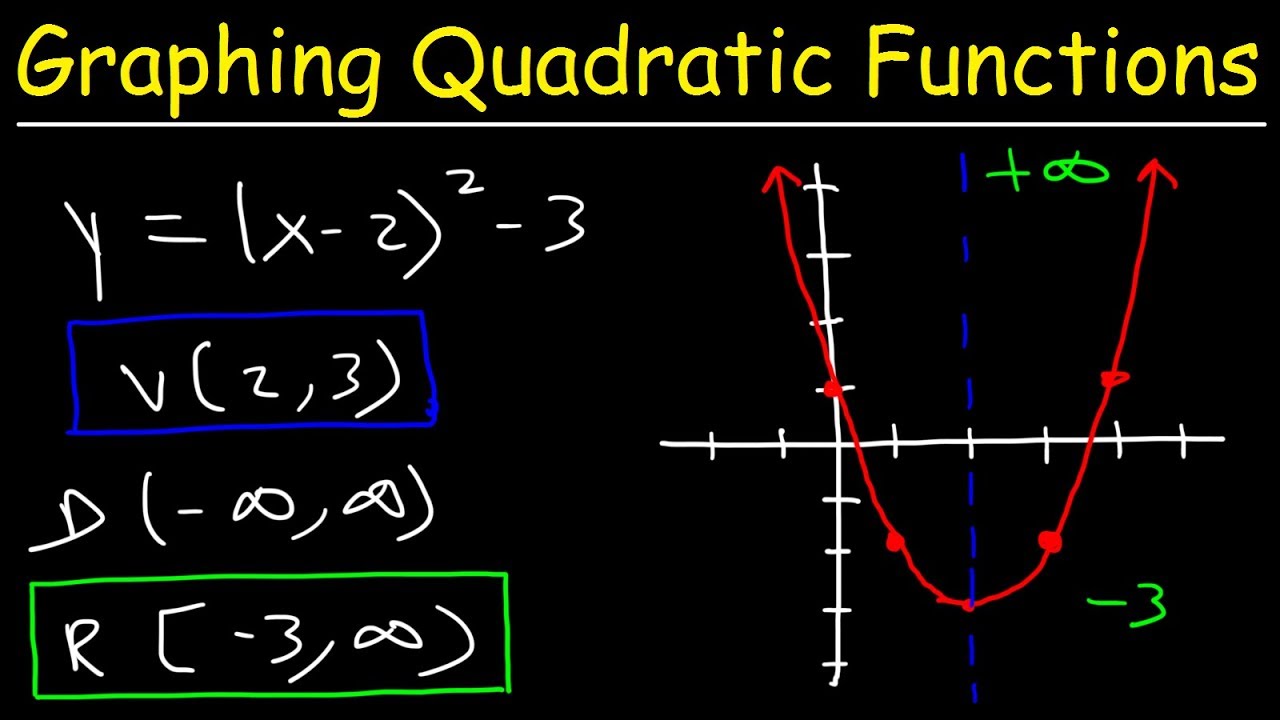
📈 Graphing Vertex Form Quadratics and Identifying Properties
The second paragraph delves into graphing quadratic functions in vertex form, y = a(x - h)^2 + k, and identifying the graph's properties. It starts by calculating the vertex coordinates (h, k) and emphasizes the importance of understanding the sign change in the vertex coordinates when converting from standard to vertex form. The paragraph outlines choosing points to the right and left of the vertex, calculating their y-values, and graphing the function. It then discusses the domain and range, which are all real numbers for the domain and from negative three to infinity for the range, including the vertex's y-coordinate as the minimum value. The axis of symmetry is expressed as x = -1, and the concept of minimum value is revisited, highlighting that it corresponds to the y-coordinate of the vertex.
Mindmap
Keywords
💡Quadratic Functions
💡Vertex
💡Axis of Symmetry
💡Domain
💡Range
💡Vertex Form
💡Standard Form
💡Minimum/Maximum Value
💡Symmetry
💡Plotting Points
Highlights
Quadratic functions can be graphed using a table, starting with the basic form y = x^2, which has its vertex at the origin (0, 0).
For the function y = x^2, points equidistant from the vertex on the left and right have the same y-values, such as (1, 1) and (-1, 1).
The domain of the function y = x^2 is all real numbers, from negative infinity to infinity, as there is no restriction on x-values.
The range of y = x^2 is from 0 to positive infinity, including 0, since the lowest y-value is at the vertex and increases without bound.
The axis of symmetry for y = x^2 is the x-coordinate of the vertex, which is x = 0, reflecting the symmetry across the y-axis.
Quadratic functions in vertex form, y = a(x - h)^2 + k, have their vertex at (h, k), simplifying the process of identifying key points for graphing.
When graphing in vertex form, the x-coordinate of the vertex can be found using the formula -b/2a, which is crucial for standard form equations.
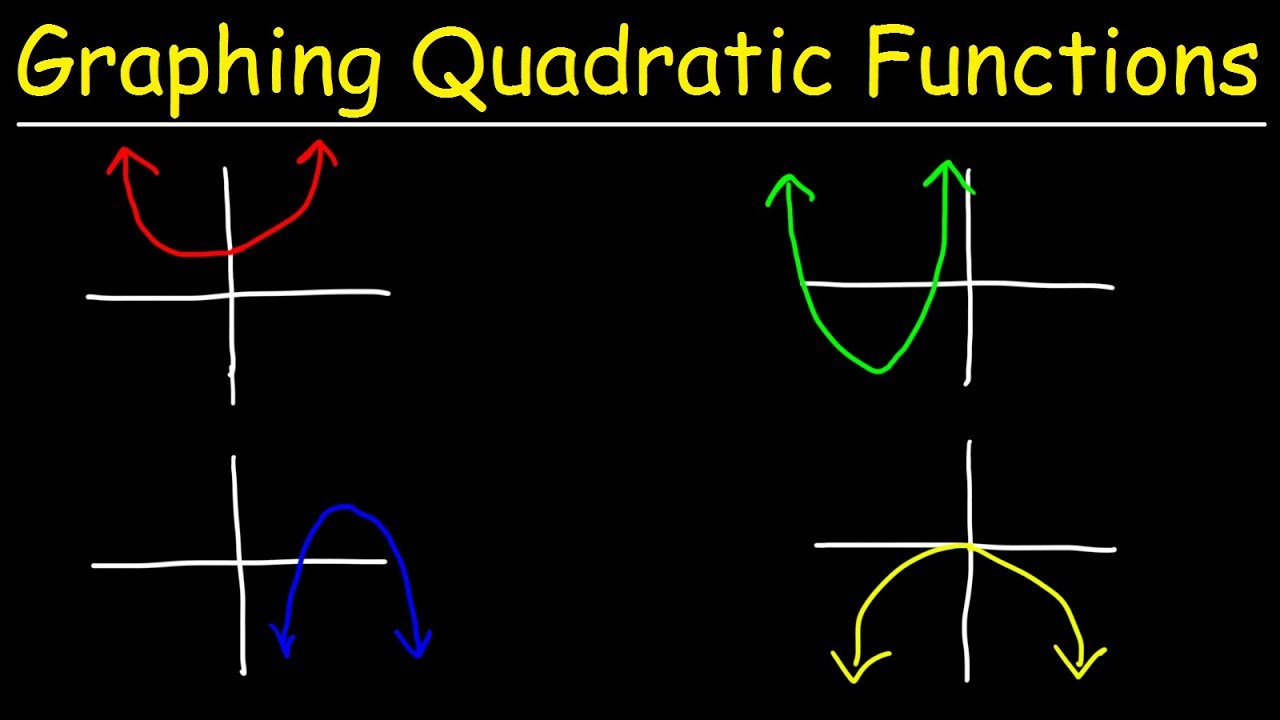
For vertex form equations, the sign of the coefficient a determines the direction the graph opens, with a positive a opening upwards and a negative a opening downwards.
The vertex form also allows for easy identification of the maximum or minimum value, which is the y-coordinate of the vertex.
The axis of symmetry for a quadratic function in any form is the x-value of the vertex, indicating a line of symmetry that divides the graph into mirrored halves.
By choosing x-values that are equidistant from the vertex, graphing becomes more efficient, as these points will share y-values.
The process of graphing quadratic functions can be applied to various forms, including standard form y = -x^2 + 4x + 1, showcasing adaptability.
For a graph opening downwards, the range includes the maximum value, which is the y-coordinate of the vertex.
The vertex form of a quadratic function simplifies the process of finding the vertex, axis of symmetry, and the maximum or minimum value.
The method for graphing quadratic functions emphasizes the importance of understanding the relationship between x and y values and their impact on the graph's shape and position.
The lesson on graphing quadratic functions provides a comprehensive understanding of the properties and characteristics of these mathematical models, which is essential for further study and application.
Transcripts
Browse More Related Video
Graphing Quadratic Functions in Vertex & Standard Form - Axis of Symmetry - Word Problems
Graphing Quadratic Functions In Vertex Form
Graphing Quadratic Functions In Standard Form Using X & Y Intercepts | Algebra
Graphing Quadratic Functions Using Transformations
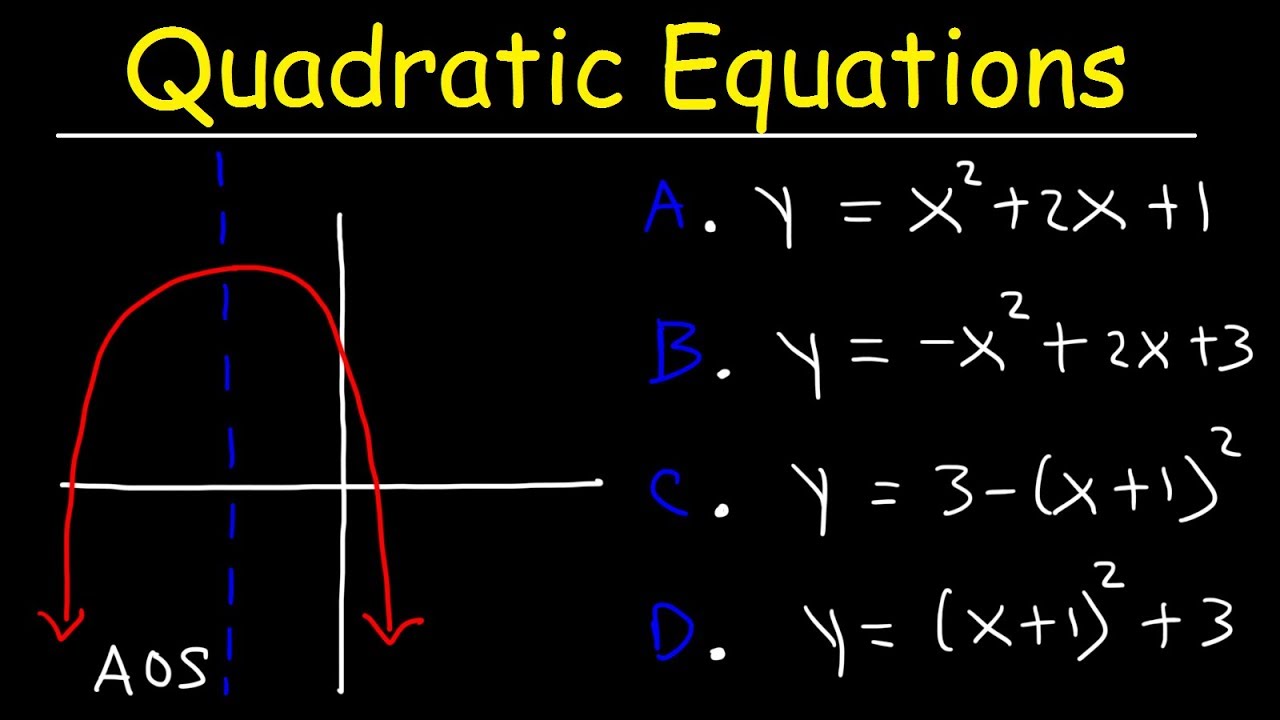
Quadratic Equations Multiple Choice Practice Problems
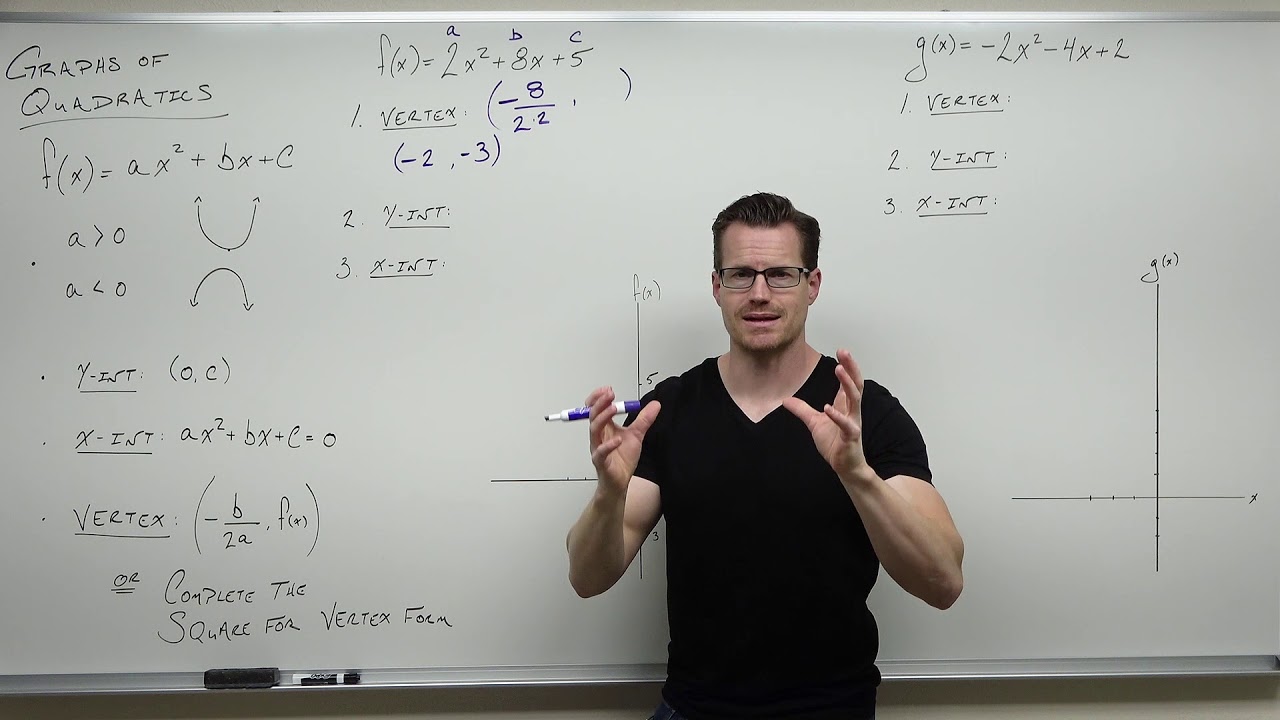
Graphing Quadratic Functions (Precalculus - College Algebra 24)
5.0 / 5 (0 votes)
Thanks for rating: