Phase Diagrams of Water & CO2 Explained - Chemistry - Melting, Boiling & Critical Point
TLDRThis educational video script delves into the phase diagrams of CO2 and water, explaining the fundamental phase changes such as melting, freezing, vaporization, condensation, sublimation, and deposition. It highlights the unique behavior of CO2, which sublimates at standard pressure, and contrasts it with water, which follows a different melting point line slope. The script also introduces the concept of the triple point, the critical point, and the distinction between boiling and normal boiling points in relation to atmospheric pressure. By examining the phase diagrams, viewers learn to determine the densities of different phases and understand the transitions between them.
Takeaways
- 🧊 Phase changes are crucial to understanding the behavior of substances like CO2 and water. The script introduces melting, freezing, vaporization, condensation, sublimation, and deposition.
- ❄️ Melting is the phase change from solid to liquid, exemplified by ice turning into water.
- 🔥 Freezing is the reverse of melting, where a liquid turns into a solid, such as water turning into ice.
- 🌫️ Vaporization is the transition from liquid to gas, while condensation is the change from gas to liquid, as seen when water vapor condenses on a cold cup.
- 💨 Sublimation is the direct conversion of a solid to a gas, bypassing the liquid phase, as observed with dry ice (solid CO2).
- 🏔️ Deposition is the reverse of sublimation, where a gas turns directly into a solid without becoming a liquid.
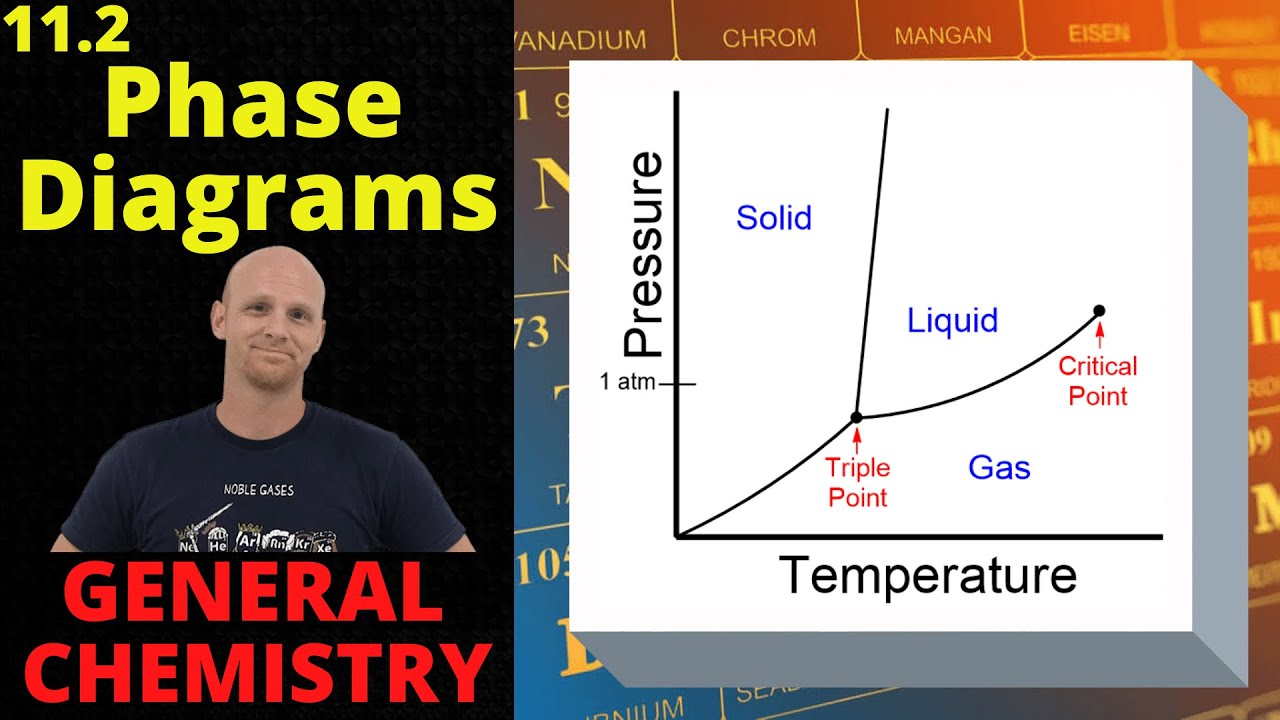
- 📈 Phase diagrams are graphical representations of the conditions under which different phases of a substance can exist, with temperature on the x-axis and pressure on the y-axis.
- 🔺 The phase diagram for CO2 shows that at one atmosphere of pressure, it can directly sublimate from a solid to a gas.
- 🧊 The density of a substance can be inferred from a phase diagram, with solid CO2 having a greater density than liquid CO2 at higher pressures due to the positive slope of the melting point line.
- 🌡️ The critical point on a phase diagram is where a substance can become a supercritical fluid, exhibiting properties of both a liquid and a gas.
- 🌊 The phase diagram for water differs from CO2, with a negative slope for the melting point line, indicating that liquid water is denser than ice, which is why ice floats.
- 🌤️ The normal boiling and melting points of water are specific points on the phase diagram that occur at one atmosphere of pressure.
Q & A
What is the phase change called when a solid turns into a liquid?
-The phase change from a solid to a liquid is called melting. An example of this is ice melting into water.
What is the term used for the reverse process of melting?
-The reverse process of melting, where a liquid turns back into a solid, is known as freezing.
What is the phase change called when a liquid becomes a gas?
-The phase change from a liquid to a gas is known as vaporization.
What happens when water vapor in the air condenses on a cold surface?
-When water vapor in the air condenses on a cold surface, such as a glass cup in a humid environment, it forms visible water droplets.
What is the process called when a solid turns directly into a gas without becoming a liquid?
-This process is known as sublimation. An example of sublimation is dry ice, which turns directly from a solid to a gas at room temperature and normal pressure.
What is the term for the reverse process of sublimation?
-The reverse process of sublimation is called deposition, where a gas turns directly into a solid without passing through the liquid phase.
What is the triple point in a phase diagram?
-The triple point in a phase diagram is the point where the solid, liquid, and gas phases coexist in equilibrium.
Why does CO2 sublime at one atmosphere of pressure?
-CO2 sublimes at one atmosphere of pressure because the pressure is below the triple point in its phase diagram, causing it to transition directly from a solid to a gas.
How can you determine the density relationship between the liquid and solid phases of a substance from a phase diagram?
-In a phase diagram, if the melting point curve (the line between solid and liquid phases) has a positive slope, it indicates that the solid phase is at a higher pressure and thus has a greater density than the liquid phase at higher pressures.
What is a supercritical fluid and how does it relate to the critical point in a phase diagram?
-A supercritical fluid is a state of matter where the substance has properties of both a gas and a liquid. It occurs at the critical point in a phase diagram, which is beyond the temperature and pressure where a gas can be liquefied by increasing pressure alone.
Why does water behave differently from CO2 in its phase transitions at one atmosphere of pressure?
-Water behaves differently from CO2 because its melting point curve has a negative slope, meaning that at one atmosphere of pressure, as temperature increases, ice melts into liquid water, which then vaporizes into a gas.
Why does ice float on water, and how does this relate to the phase diagram of water?
-Ice floats on water because liquid water has a higher density than ice. This is reflected in the phase diagram of water, where the liquid phase is at a higher pressure than the solid phase, indicating greater density for the liquid.
What is the significance of the normal boiling point and normal melting point of water in relation to its phase diagram?
-The normal boiling point and normal melting point of water are specific points on the phase diagram where the pressure is exactly one atmosphere. These points represent the temperatures at which water boils or melts under standard atmospheric conditions.
Outlines
🧊 Phase Changes and CO2 Phase Diagram
This paragraph introduces phase changes, such as melting, freezing, vaporization, condensation, sublimation, and deposition. It uses the example of dry ice (solid CO2) to illustrate sublimation, where solid CO2 turns directly into a gas without becoming a liquid. The phase diagram for CO2 is explained, with the axes representing temperature and pressure. The diagram includes the triple point, where solid, liquid, and gas phases coexist, and the melting point line and boiling point curve. It is noted that at standard pressure (1 atm), CO2 sublimates directly from solid to gas. The question of density comparison between solid and liquid CO2 is raised, and the explanation is provided that increasing pressure increases density by compacting atoms, which is more pronounced in the liquid phase.
🌡️ CO2 and Water Phase Diagrams: Density and Critical Points
The second paragraph delves into the phase diagram of CO2, explaining how the density of solid CO2 is greater than that of liquid CO2 at higher pressures due to the positive slope of the melting point curve. It introduces the concept of the critical point, where a supercritical fluid exists that has properties of both a gas and a liquid. This fluid can dissolve certain materials and diffuse through others. The paragraph then contrasts the phase diagram of water with that of CO2, noting the negative slope of water's melting point line and the fact that at 1 atm pressure, all three phases of water can coexist. It discusses the sublimation of ice into gas when the pressure is below the triple point. The density of water is also discussed, explaining that liquid water is denser than ice, which is why ice floats. The critical point's temperature and pressure are mentioned, and the distinction between the boiling point curve and the normal boiling point of water at 1 atm pressure is clarified.
🌡️ Normal Melting and Boiling Points in Phase Diagrams
The final paragraph focuses on the specific points within the phase diagrams that correspond to the normal melting and boiling points of substances. It emphasizes that the term 'normal' is used when the pressure is at one atmosphere (1 atm). The normal melting point and boiling point are identified as specific points on their respective curves where the pressure is standard. This paragraph reinforces the idea that the phase behavior, including melting and boiling, is dependent on both temperature and pressure, and that the 'normal' points are commonly referenced values in everyday contexts.
Mindmap
Keywords
💡Phase Diagrams
💡Melting
💡Freezing
💡Vaporization
💡Condensation
💡Sublimation
💡Deposition
💡Triple Point
💡Critical Point
💡Supercritical Fluid
💡Boiling Point Curve
💡Density and Phases
Highlights
Introduction to phase diagrams for CO2 and water.
Explanation of phase changes: melting, freezing, vaporization, condensation, sublimation, and deposition.
Sublimation of dry ice (solid CO2) directly into gas without becoming liquid.
Phase diagram of CO2 with temperature on the x-axis and pressure on the y-axis.
Identification of the triple point where solid, liquid, and gas phases of CO2 coexist.
Differentiation between the melting point line and the boiling point curve on the CO2 phase diagram.
Behavior of CO2 at one atmosphere of pressure, directly sublimating from solid to gas.
Density comparison between liquid and solid phases of CO2 based on the phase diagram.
Critical point on the phase diagram where a supercritical fluid exists.
Properties of a supercritical fluid, having characteristics of both gas and liquid.
Inability to liquefy a gas by increasing pressure beyond the critical point.
Phase diagram for water, with a different slope for the melting point line compared to CO2.
Sublimation of ice into water vapor when pressure is below the triple point.
Density comparison between ice and liquid water, with liquid water being denser.
Explanation of why ice floats on water due to its lower density compared to liquid water.
Critical temperature and pressure for water, leading to the formation of a supercritical fluid.
Difference between the boiling point curve and the normal boiling point of water at one atmosphere.
Definition of the normal melting point of water occurring at one atmosphere of pressure.
Transcripts
Browse More Related Video

Phase Changes, Heats of Fusion and Vaporization, and Phase Diagrams

phase diagram practice problems explained
11.2 Phase Diagrams | General Chemistry

Phase diagrams | States of matter and intermolecular forces | Chemistry | Khan Academy

Phase Diagrams | Phase Diagram of Water and Phase Diagram of Carbon Dioxide
10.2 Phase Diagrams | High School Chemistry
5.0 / 5 (0 votes)
Thanks for rating: