10.2 Phase Diagrams | High School Chemistry
TLDRThis lesson delves into phase diagrams, focusing on the relationship between pressure and temperature for various substances. It explains the typical phase diagram, highlighting the solid, liquid, and gas phases, and introduces key terms such as normal melting and boiling points. The script explores unique behaviors of carbon dioxide, which sublimates at one atmosphere, and water, whose solid-liquid equilibrium line has an unusual negative slope due to hydrogen bonding. The critical point, where no liquid-gas phase transition occurs, is also discussed, along with the implications for everyday phenomena and sports like ice hockey.
Takeaways
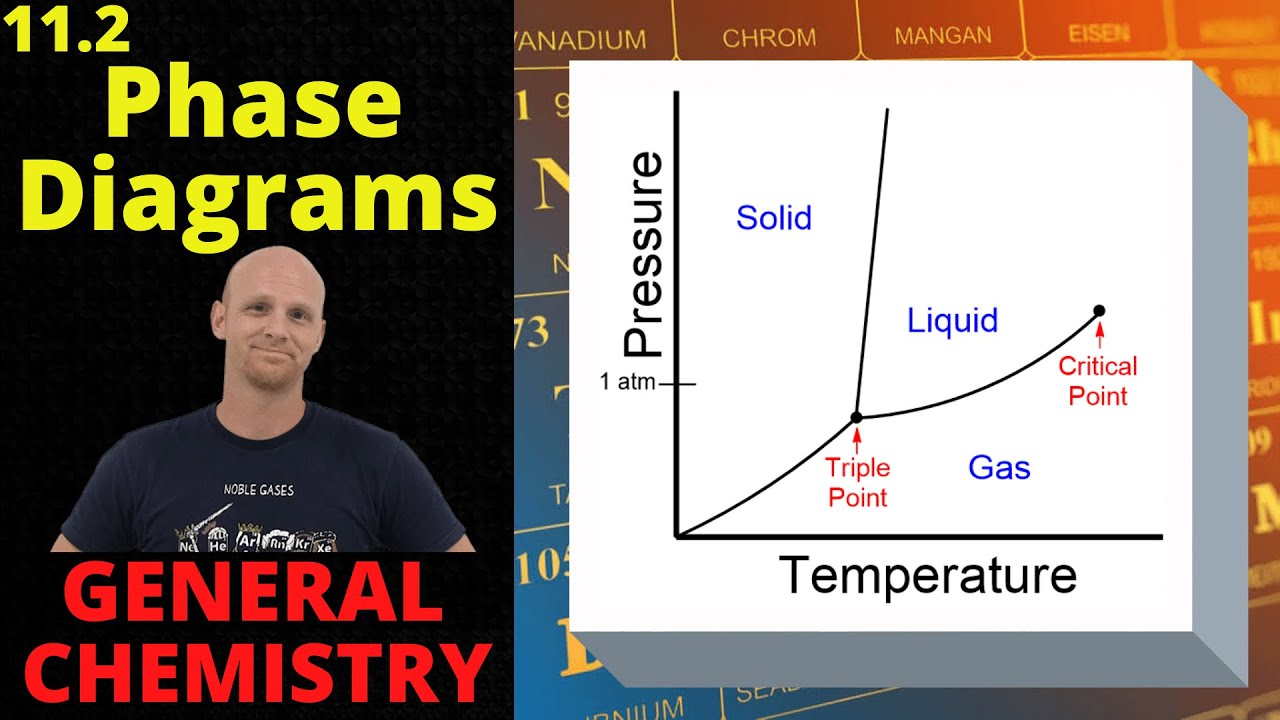
- 📊 The phase diagram is a graph of pressure versus temperature, showing the regions and transitions between solid, liquid, and gas phases.
- 🌡️ At one atmosphere of pressure, substances typically transition from solid to liquid at the normal melting point and from liquid to gas at the normal boiling point.
- 🧊 The melting and boiling points of substances are pressure-dependent, meaning they can change at pressures other than one atmosphere.
- 🔄 The lines on a phase diagram represent equilibrium between phases, such as the solid-liquid, liquid-gas, and solid-gas lines of equilibrium.
- 💧 The triple point is the unique point where all three phases—solid, liquid, and gas—are in equilibrium.
- 🔍 The critical point is where the liquid-gas line of equilibrium ends, indicating the temperature and pressure beyond which there is no distinct liquid-gas phase transition.
- 🌫️ Beyond the critical point, a substance exists as a supercritical fluid, which has properties of both liquid and gas.
- 🧊 For carbon dioxide, the triple point is below one atmosphere, meaning liquid carbon dioxide does not exist at normal atmospheric pressure and it sublimates directly from solid to gas.
- ❄️ Water's phase diagram is unique due to its solid-liquid line of equilibrium having a negative slope, indicating that ice is less dense than liquid water, which is attributed to hydrogen bonding.
- ⛸ The property of ice melting under pressure is crucial for life, as it allows ice to float and insulate bodies of water, and also makes ice hockey possible due to the reduced friction when the ice melts slightly under the skate.
- 🏒 The practical joke idea of replacing ice in a hockey rink with dry ice highlights the importance of water's unique phase behavior for the sport.
Q & A
What is the topic of the second lesson and chapter discussed in the script?
-The topic is phase diagrams, specifically focusing on graphs of pressure versus temperature and the unique characteristics of these graphs for different substances.
What are the three different phases represented on a typical phase diagram?
-The three different phases are solid, liquid, and gas.
What is the significance of the line separating the solid and liquid phases on a phase diagram?
-The line separating the solid and liquid phases is called the solid-liquid line of equilibrium. It represents the phase transition temperature where solid and liquid phases coexist in equilibrium.
What is the term used for the point where all three phases (solid, liquid, and gas) are in equilibrium?
-This unique point is called the triple point.
What are the normal melting point and normal boiling point, and how are they defined in relation to pressure?
-The normal melting point (NMP) and normal boiling point (NBP) are the temperatures at which a substance melts and boils, respectively, at one atmosphere of pressure. These points are specific to one atmosphere and can change at different pressures.
What is the critical point in a phase diagram, and what does it signify?
-The critical point is a specific temperature and pressure at which there is no distinct liquid-gas phase transition. Beyond this point, the substance exists as a supercritical fluid, which is neither a liquid nor a gas.
How does the phase behavior of carbon dioxide differ from that of a typical substance at one atmosphere of pressure?
-Carbon dioxide does not exist in a liquid state at one atmosphere of pressure. Instead, it sublimates directly from solid (dry ice) to gas, bypassing the liquid phase.
What is unique about the solid-liquid line of equilibrium for water compared to a typical substance?
-For water, the solid-liquid line of equilibrium has a negative slope, meaning that ice (solid phase) is less dense than liquid water. This is due to hydrogen bonding, which causes ice to expand when it freezes.
Why is the behavior of water's solid-liquid phase transition important for life on Earth?
-The fact that ice floats on water is crucial for life on Earth. It insulates bodies of water, preventing them from freezing completely and allowing aquatic life to survive in colder climates.
How does the pressure affect the phase transition of water, and what is the significance of this in ice hockey?
-High pressure causes ice to melt into water. In ice hockey, the pressure from a player's skate on the ice creates a thin layer of liquid water, which reduces friction and allows for smoother skating.
Outlines
📈 Understanding Phase Diagrams of Solids and Liquids
This paragraph introduces the concept of phase diagrams, focusing on the relationship between pressure and temperature. It explains the typical phase diagram for a substance, showing the transitions from solid to liquid to gas. The script also highlights the unique characteristics of phase diagrams for carbon dioxide and water, emphasizing the importance of understanding the 'normal melting point' and 'normal boiling point' at one atmosphere of pressure. The paragraph defines key terms such as 'lines of equilibrium' and 'triple point,' and it discusses the concept of phase changes, including melting, freezing, boiling, condensation, sublimation, and deposition. It challenges the viewer to identify phase changes on a phase diagram.
🌡 The Critical Point and Phase Transitions
The second paragraph delves into the concept of the critical point, which is characterized by a critical pressure and temperature where the distinction between liquid and gas phases disappears. It uses a hypothetical scenario to illustrate how gases can be converted into liquids by either increasing pressure or decreasing temperature. The paragraph clarifies that beyond the critical point, the substance exists as a 'supercritical fluid,' which does not undergo a liquid-gas phase transition. It also emphasizes the noticeable volume change when a gas condenses into a liquid, providing a vivid example of a 55-gallon drum imploding due to the rapid condensation of superheated steam.
🧊 Unique Properties of Carbon Dioxide and Water
This paragraph discusses the distinctive behavior of carbon dioxide and water in their phase diagrams. It points out that carbon dioxide, unlike most substances, does not exist as a liquid at one atmosphere of pressure and instead sublimates directly from a solid to a gas, a process unique to dry ice. In contrast, water's phase diagram is highlighted by its solid-liquid line of equilibrium having a negative slope, which is attributed to hydrogen bonding. This results in water expanding when it freezes, a property that is crucial for life, as it allows ice to float and insulate bodies of water. The paragraph also humorously touches on the implications of these properties for ice hockey, suggesting that without water's unique behavior, the sport would be less enjoyable.
⛸ The Importance of Water's Phase Behavior in Daily Life and Sports
The final paragraph emphasizes the practical implications of water's phase behavior, particularly how the negative slope of the solid-liquid line of equilibrium affects the sport of ice hockey. It explains that the pressure exerted by a skater's blade on the ice causes a thin layer of water to form, reducing friction and allowing for smoother gliding. The paragraph humorously proposes a prank involving replacing rink ice with dry ice, which would prevent the formation of this slippery layer and disrupt the game. It concludes by encouraging viewers to engage with the content through likes and shares, and by directing them to additional resources on chatsprep.com.
Mindmap
Keywords
💡Phase Diagram
💡Normal Melting Point (NMP)
💡Normal Boiling Point (NBP)
💡Lines of Equilibrium
💡Triple Point
💡Critical Point
💡Phase Transition
💡Sublimation
💡Deposition
💡Hydrogen Bonding
💡Supercritical Fluid
Highlights
The topic of phase diagrams, focusing on pressure versus temperature graphs for different substances.
Introduction of unique vocabulary associated with phase diagrams and their regions or points.
Explanation of the typical phase diagram for substances, including solid, liquid, and gas phases.
Identification of the normal melting point (NMP) and normal boiling point (NBP) at one atmosphere of pressure.
The dependency of melting and boiling points on pressure.
Description of lines of equilibrium for phase transitions.
The triple point, where solid, liquid, and gas phases coexist in equilibrium.
Identification of the six phase changes on a phase diagram.
Introduction of the critical point with its critical pressure and temperature.
The concept of supercritical fluids beyond the critical point.
Differences in phase diagrams for carbon dioxide, which sublimates instead of melting at one atmosphere.
Water's unique phase diagram due to hydrogen bonding, with a negative slope in the solid-liquid line of equilibrium.
Explanation of why ice floats and its importance for life and ice hockey.
The practical joke idea of replacing ice in a hockey rink with dry ice.
The importance of understanding phase diagrams for various substances in chemistry.
Invitation for feedback and resources for further study on phase diagrams.
Transcripts


5.0 / 5 (0 votes)
Thanks for rating: