Second Derivative Test to find relative maximums and minimums (extrema)
TLDRIn this informative video, Professor Monty explains the process of using the second derivative test to identify relative maximums of a function. The video begins with finding the critical values by setting the first derivative of the function, 3x^2 - 6x - 24, equal to zero. After solving, the critical values obtained are x = 4 and x = -2. The second derivative test involves taking the second derivative of the function, 6x - 6, and substituting the critical values into it. A positive second derivative at x = 4 indicates a concave up shape, signifying a relative minimum, while a negative second derivative at x = -2 indicates a concave down shape, indicating a relative maximum. The video concludes with the function's graph, showing a relative minimum at (4, -75) and a relative maximum at (-2, 33). The presenter encourages viewers to practice the method for better understanding.
Takeaways
- 📚 First, find the critical values by setting the first derivative equal to zero and solving for x.
- 🔍 Factor the first derivative, 3x^2 - 6x - 24, to find x - 4 and x + 2 as the critical points.
- 🚫 Remember that 3 cannot equal zero, so we disregard that factor.
- 🔑 Solve x - 4 = 0 for x = 4 and x + 2 = 0 for x = -2 to find the critical values.
- 📈 Use the second derivative test by taking the derivative of the first derivative (6x - 6).
- 🔁 Plug the critical values into the second derivative to determine concavity.
- ➡️ If the second derivative is positive (concave up), it indicates a minimum at that point.
- ⬅️ If the second derivative is negative (concave down), it indicates a maximum at that point.
- 📌 To find the y-values of the relative extrema, substitute the critical x-values into the original function.
- 📊 For the given function, a relative minimum is found at (4, -75) and a relative maximum at (-2, 33).
- 📈 The graph of a cubic function will have a shape influenced by its critical points and concavity.
- 📝 Practice is key to mastering the second derivative test and applying it to different functions.
Q & A
What is the first step in using the second derivative test to find relative maxima?
-The first step is to find the critical values by taking the first derivative of the function and setting it equal to zero.
What is the function given in the transcript for finding critical values?
-The function given is 3x^2 - 6x - 24.
How does one factor the first derivative of the function to find critical values?
-The first derivative is factored by taking out a common factor of 3, resulting in x^2 - 2x - 8, which further factors into (x - 4)(x + 2).
What are the critical values found in the transcript?
-The critical values are x = 4 and x = -2.
What does the second derivative test involve after finding the critical values?
-The second derivative test involves taking the second derivative of the function and then plugging in the critical values to determine if they correspond to a relative maximum, minimum, or neither.
How does the sign of the second derivative indicate the concavity of the function at a critical point?
-If the second derivative is positive, the function is concave up, indicating a relative minimum. If the second derivative is negative, the function is concave down, indicating a relative maximum.
What is the second derivative of the given function?
-The second derivative is 6x - 6.
What is the value of the second derivative at x = 4?
-At x = 4, the second derivative is 6(4) - 6, which equals 18.
What is the value of the second derivative at x = -2?
-At x = -2, the second derivative is 6(-2) - 6, which equals -18.
How can you find the y-values of the relative maximum and minimum?
-To find the y-values, plug the x-values of the relative maximum and minimum back into the original function.
What are the coordinates of the relative maximum and minimum found in the transcript?
-The relative minimum is at (4, -75) and the relative maximum is at (-2, 33).
What is the general shape of the graph of a cubic function with a positive leading coefficient?
-The graph of a cubic function with a positive leading coefficient will start from negative infinity, have a local maximum and minimum, and approach positive infinity as x goes to positive or negative infinity.
Why is the second derivative test a useful method for determining relative extrema?
-The second derivative test is useful because it provides a way to determine the nature of a critical point without constructing a sign chart or using other more complex methods.
Outlines
📚 Introduction to the Second Derivative Test
The video begins with an introduction to the second derivative test, a method for finding relative maximums and minimums of a function. The professor, Monty, explains the process of finding critical values by taking the first derivative of the given function (3x^2 - 6x - 24), setting it to zero, and solving for x. This results in two critical values: x = 4 and x = -2.
🔍 Applying the Second Derivative Test
Monty then demonstrates how to apply the second derivative test by finding the second derivative of the function (6x - 6) and evaluating it at the critical points. For x = 4, the second derivative is positive, indicating a concave up shape and thus a relative minimum. Conversely, for x = -2, the second derivative is negative, indicating a concave down shape and a relative maximum. The significance of the sign of the second derivative is emphasized as a key determinant in identifying the nature of the critical points.
📈 Calculating Function Values at Critical Points
After identifying the nature of the critical points, Monty shows how to find the corresponding y-values by substituting the x-values back into the original function. This results in the y-values for the relative minimum at x = 4 being -75, and for the relative maximum at x = -2 being 33. These points are then clearly defined as (4, -75) for the minimum and (-2, 33) for the maximum.
📈 Visualizing the Function's Graph
Monty briefly discusses how the function's graph can be visualized, noting that the function is a cubic and thus the graph will have a specific shape. He mentions that with the relative maximum at (-2, 33) and the relative minimum at (4, -75), the overall graph can be sketched accordingly. The ease of graphing is tied to the ability to factor and find critical values.
📝 Conclusion and Engagement
The video concludes with Monty summarizing the second derivative test and encouraging practice to master the technique. He also invites viewers to subscribe to his channel and like the video if they found it helpful, promising more informative content in future videos.
Mindmap
Keywords
💡Second Derivative Test
💡Critical Values
💡First Derivative
💡Concave Up
💡Concave Down
💡Relative Maximum
💡Relative Minimum
💡Factoring
💡Graph of a Function
💡Cubic Function
💡Derivative
Highlights
The second derivative test is used to find relative maximums of a function.
First, find the critical values by taking the first derivative and setting it equal to zero.
For the given function 3x^2 - 6x - 24, the critical values are x = -2 and x = 4.
Next, take the second derivative of the function, which is 6x - 6.
Plug in the critical values into the second derivative to determine concavity.
If the second derivative is positive, the graph is concave up and it's a minimum.
If the second derivative is negative, the graph is concave down and it's a maximum.
For the given function, f''(4) = 18 (positive) so there's a minimum at x = 4.
For the given function, f''(-2) = -18 (negative) so there's a maximum at x = -2.
To find the y-values of the relative max/min, plug the x values back into the original function.
The relative minimum is at (x,y) = (4, -75).
The relative maximum is at (x,y) = (-2, 33).
The graph of the function is a cubic with a relative maximum at (-2, 33) and minimum at (4, -75).
The second derivative test is easier to apply when the function is easier to factor and find critical values.
The second derivative test does not require a sign chart or other complicated steps.
The second derivative test provides a straightforward way to find relative extrema of a function.
Practice applying the second derivative test to different functions to gain proficiency.
The video provides a clear, step-by-step explanation of the second derivative test.
Transcripts
Browse More Related Video
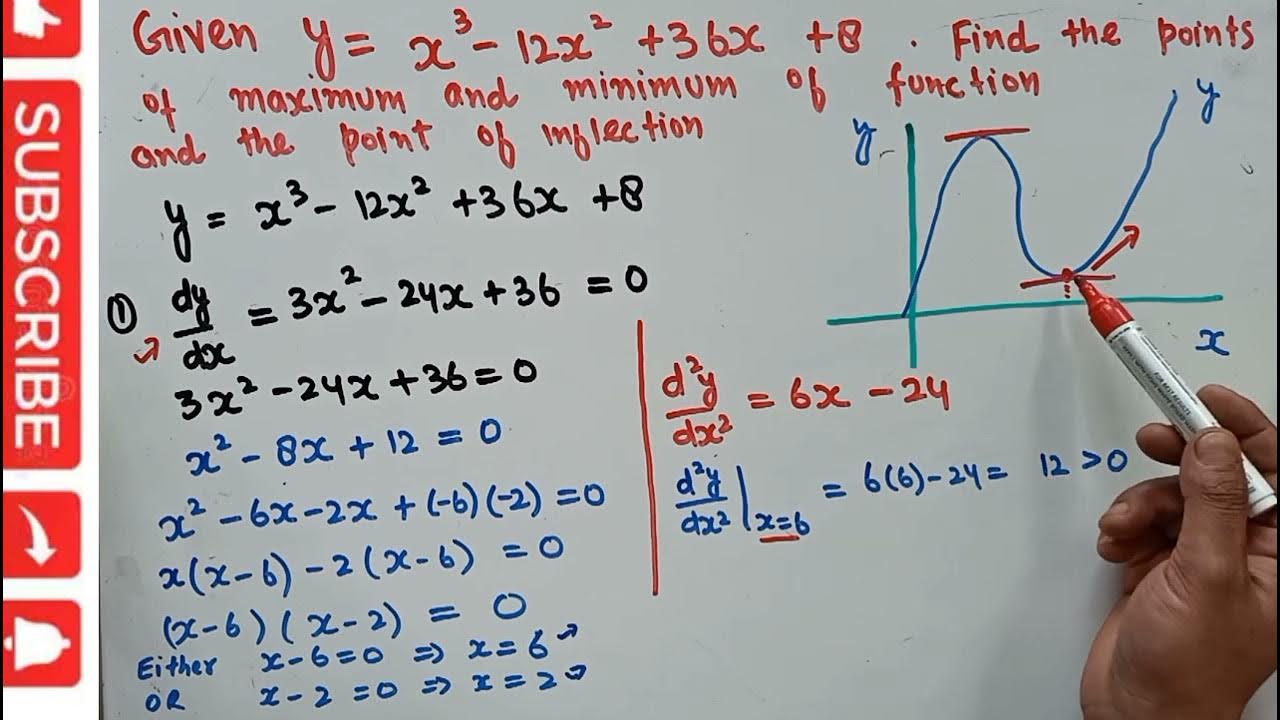
Maxima , minima and point of inflection
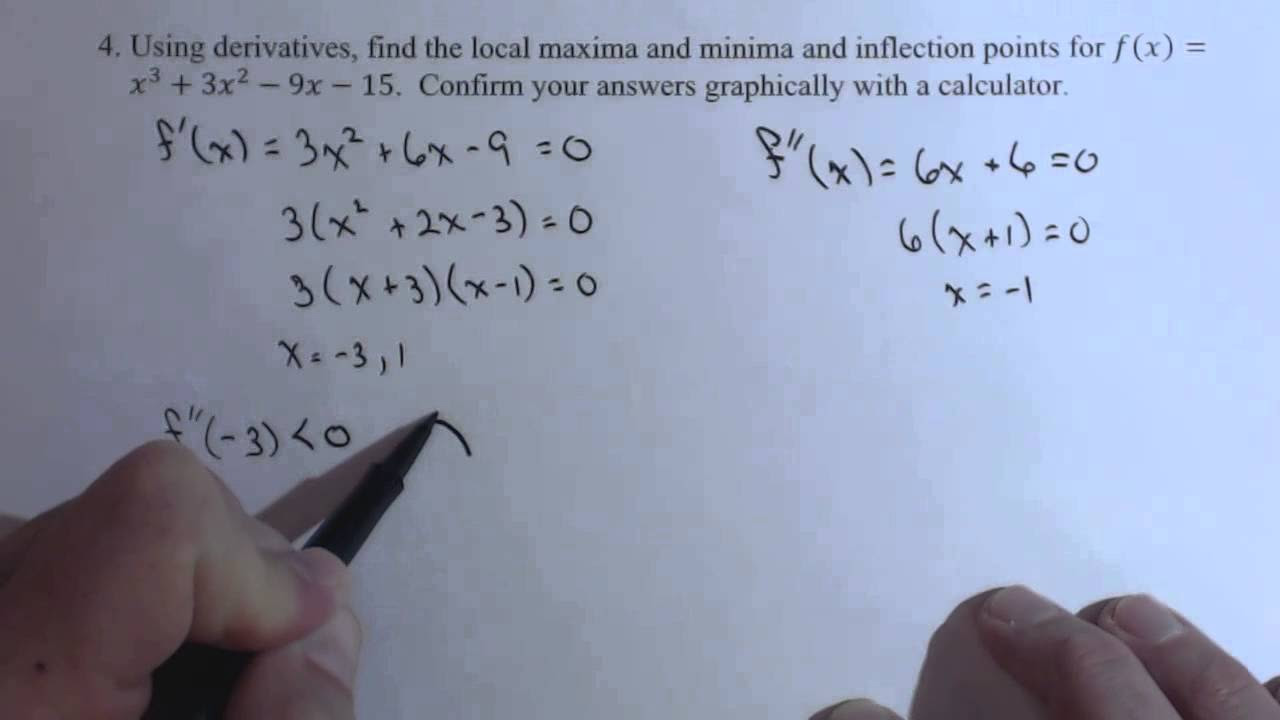
Fiding Relative Max, Min and Inflection Point with Derivatives F4
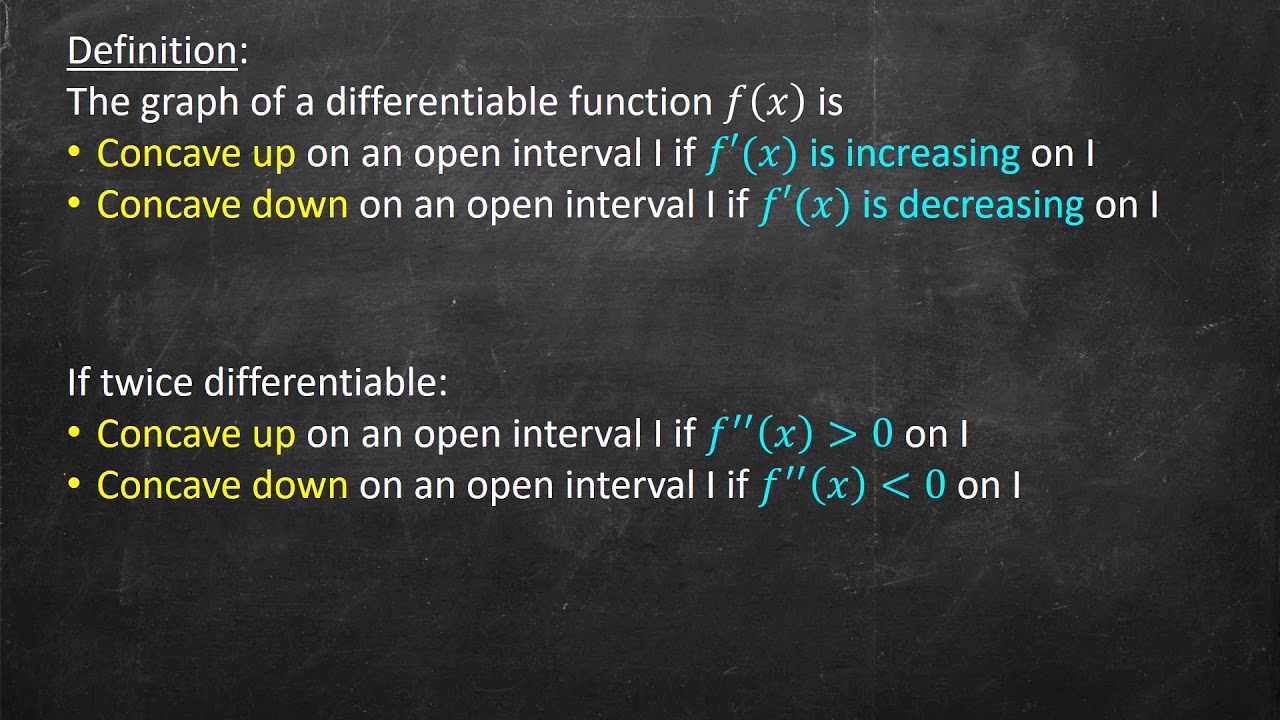
Concavity and the 2nd Derivative Test

Finding Concavity and Inflection Points

First Derivative Test to find increasing/decreasing and relative max/min

Calculus I: Finding Intervals of Concavity and Inflection point
5.0 / 5 (0 votes)
Thanks for rating: