Random Variables and Probability Distributions
TLDRIn this video, Dr. Nic explains the concept of random variables, distinguishing between discrete and continuous types. Using the example of Luke's ice cream sales, the video demonstrates how to calculate probabilities and make business decisions based on historical data. The video also provides examples of discrete random variables, such as the number of ice creams sold, and continuous random variables, like the weight of an ice cream. Viewers are guided on identifying different types of random variables and are encouraged to visit the Statistics Learning Centre for more resources.
Takeaways
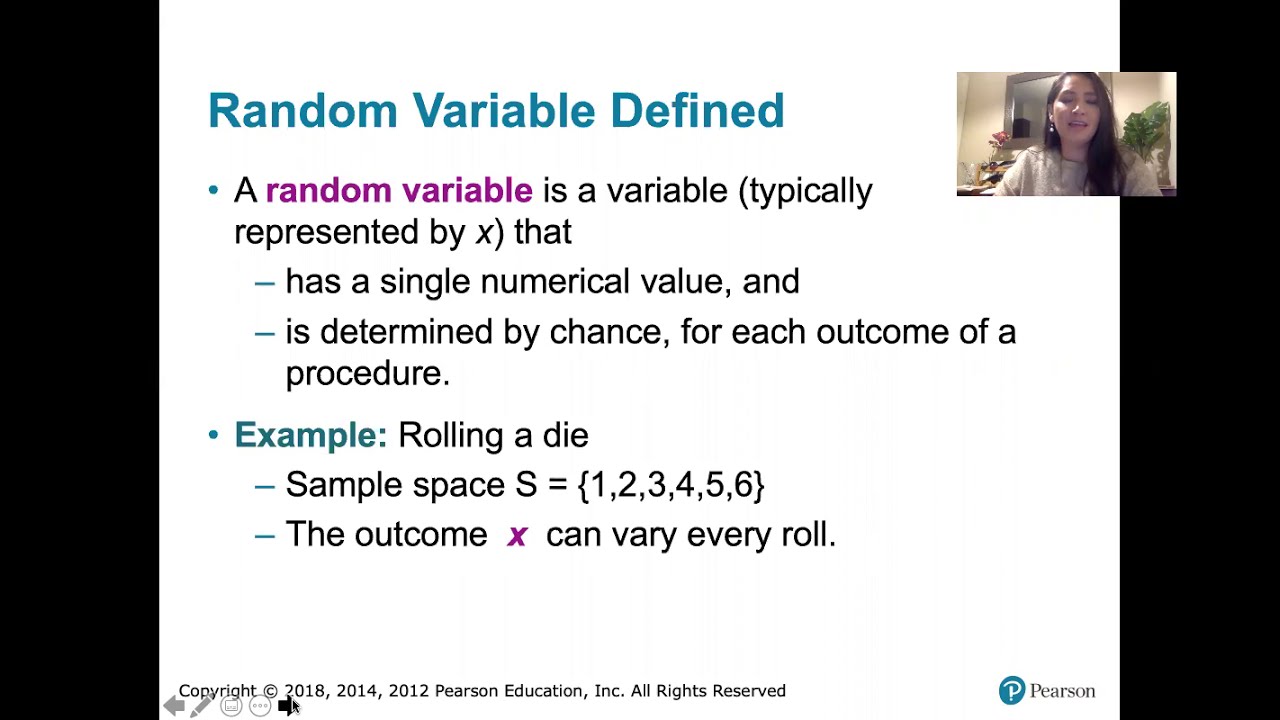
- 📚 A random variable is a numerical outcome of a chance event that can be measured or counted.
- 🍦 The example of Luke's ice cream stand helps illustrate the concept of a random variable, where X represents the number of ice creams a customer orders.
- 📊 Random variables can be either discrete or continuous, with discrete variables taking specific values (like whole numbers) and continuous variables taking any value within a range.
- 🔍 Probability distributions can be used to estimate the likelihood of different outcomes for a random variable, such as the number of ice creams bought by a customer.
- 📈 The distribution of a random variable can be visualized using dot diagrams, histograms, or graphs, which help in understanding the frequency of different outcomes.
- 🤔 Questions about future outcomes, like the probability of a customer buying exactly one ice cream, can be answered using the probability distribution of the random variable.
- 🧩 Discrete random variables are suitable for modeling countable events, such as the number of customers arriving in an hour or the number of days a stall is closed due to rain.
- 🚫 Continuous random variables are used for modeling events that can take any value within a range, such as the weight of an ice cream or the time taken to serve a customer.
- 🌟 The distinction between discrete and continuous random variables is crucial for understanding how to model and analyze different types of data.
- 🔎 Summary values and operations involving random variables, as well as specific distributions, will be covered in later videos, providing a deeper understanding of statistical analysis.
- 📘 The video is part of a series by the Statistics Learning Centre, which offers resources and educational content on statistical concepts.
Q & A
What is a random variable?
-A random variable is the result of a chance event that you can measure or count. It can take several different values and is the result of a chance happening.
Why is the result of getting a lunch with an apple and a banana cake not considered a random variable?
-The result of getting a lunch with an apple and a banana cake is not a random variable because it is not a number; it is a specific outcome of a chance event.
What does Luke want to analyze with his ice cream sales data?
-Luke wants to analyze his ice cream sales to make decisions about employing an assistant and expanding his business.
How does Luke define the random variable X in his ice cream sales data?
-Luke defines X as the number of ice creams a customer orders. This is a random variable because it can take different values based on customer orders.
How can the probability for each value of a random variable be estimated?
-The probability for each value of a random variable can be estimated by finding the relevant frequencies from historical or experimental data.
What is the probability that the next customer will buy exactly one ice cream according to Luke's data?
-The probability that the next customer will buy exactly one ice cream is 0.45 or 45%.
How many customers out of 200 would be expected to buy more than three ice creams based on Luke's data?
-Based on Luke's data, you would expect 20 customers out of the next 200 to buy more than three ice creams.
What is a discrete random variable?
-A discrete random variable is one that can only take whole numbers, such as the number of ice creams bought or the number of customers arriving in an hour.
What is a continuous random variable?
-A continuous random variable is one that can take any value within a range, including fractions. Examples include the weight of an ice cream or the time it takes to serve a customer.
Which of the following would not be modeled as a discrete random variable: the flavor topping a customer chooses, the ethnicity of the customer, or the method the customer uses to pay?
-All of these (the flavor topping a customer chooses, the ethnicity of the customer, and the method the customer uses to pay) would not be modeled as discrete random variables because they cannot be counted.
Which of the following would be modeled as a continuous random variable: the weight of a suitcase, the number of emergency calls in an hour, or the time taken to get to a fire?
-The weight of a suitcase and the time taken to get to a fire would be modeled as continuous random variables, as they can take any value within a range.
What are some examples of discrete random variables mentioned in the script?
-Examples of discrete random variables mentioned in the script include the number of customers who arrived in the next hour, the number of customers who pay by cash, the number of days in a month in which the stall is closed due to rain, and the number of cones that break while being filled.
How can the distribution of a random variable be represented?
-The distribution of a random variable can be represented as a dot diagram, a graph, or a table listing the number of occurrences of each value.
Outlines
🍦 Understanding Random Variables
In this segment, Dr. Nic introduces the concept of random variables and distinguishes between discrete and continuous types. A random variable is defined as a measurable outcome of a chance event, exemplified by the number of ice creams a customer orders at Luke's ice cream stand. The video uses a table and dot diagram to illustrate the distribution of this discrete random variable, X. It further explains how to estimate probabilities for different values of X and answer questions about future customer behavior, such as the likelihood of a customer buying exactly one ice cream or the expected number of customers buying more than three ice creams. The segment also explores examples of discrete random variables like the number of customers arriving in an hour or the number of days a stall is closed due to rain, contrasting them with continuous random variables like the weight of an ice cream or the time taken to serve a customer. The video concludes by posing a series of questions to help viewers decide whether certain scenarios can be modeled as discrete or continuous random variables.
📚 Answers to Random Variable Questions
This paragraph serves as a conclusion to the video, providing answers to the questions posed earlier about what can be modeled as discrete or continuous random variables. The answers help solidify the understanding of the concepts discussed in the video and encourage viewers to apply this knowledge to various real-world scenarios. The video also promotes further learning by inviting viewers to visit the Statistics Learning Centre's website for more resources and to support the production of educational content through Patreon. Additionally, viewers are encouraged to subscribe to the channel for updates on new videos.
Mindmap
Keywords
💡Random Variable
💡Discrete Random Variable
💡Continuous Random Variable
💡Probability
💡Distribution
💡Frequency
💡Expected Value
💡Experimental Data
💡Summary Values
💡Specific Distributions
Highlights
Understanding Random Variables, Hi, I'm Dr Nic, and I'm going to help you learn what random variables are, and what they do.
A random variable is the result of a chance event that you can measure or count.
Luke has an ice cream stand, and sells hand-scooped, home-made ice creams in cones.
Luke wishes to analyze his sales, and make decisions about employing an assistant, and expanding his business.
We can define X as being the number of ice creams a customer orders. X is a random variable.
We estimate the probability for each value of X by finding the relevant frequencies from the historic or experimental data.
The distribution for X, the number of ice creams one customer buys, looks like this.
Luke wants to know, what is the probability that the next customer will buy exactly one ice cream? The probability that X equals one is .45, or 45%.
Out of 200 customers, how many would we expect to buy more than three ice creams? The probability that X is greater than three is .1, or 10%.
This example of the number of ice creams is an example of a discrete distribution, as you can only get whole numbers of ice creams.
Examples of discrete random variables: Number of customers who arrive in the next hour, Number of customers who pay by cash, Number of days in a month the stall is closed due to rain, Number of cones that break while being filled.
Examples that cannot be modeled as discrete random variables: The flavor topping a customer chooses, The ethnicity of the customer, The method the customer uses to pay.
Some random variables are continuous, which means they can take any value within a range, including fractions.
Continuous random variable examples: The weight of an ice cream, Time taken to serve a customer, Time taken to scoop an ice cream.
Decide whether the following would be discrete random variables, continuous random variables, or not random variables: Weight of a suitcase, Number of emergency calls in an hour, Marital status, Time taken to get to a fire, Length of a tulip stem, Color of a tulip flower, Number of bulbs that produce flowers.
Transcripts
Browse More Related Video
5.1.1 Discrete Probability Distributions - Discrete and Continuous Random Variables

Introduction to Discrete Random Variables and Discrete Probability Distributions

Elementary Statistics - Chapter 5 Probability Distributions Part 1

Discrete and continuous random variables | Probability and Statistics | Khan Academy

Probability density functions | Probability and Statistics | Khan Academy
Continuous Random Variables: Probability Density Functions
5.0 / 5 (0 votes)
Thanks for rating: