3.1 - Using First Derivatives to Classify Max and Min Values
TLDRThe video script delves into the application of derivatives in optimization problems, focusing on the concept of critical values and the first derivative test. It explains how to identify intervals of increasing and decreasing functions by analyzing the sign of the derivative. The script outlines a methodical approach to finding relative maxima and minima by first finding the derivative of a function, then solving for critical points where the derivative is zero or undefined. It further discusses the use of a sign chart and the first derivative test to determine the nature of these critical points as either relative maxima, minima, or points of inflection. The process is illustrated with examples, emphasizing the practical significance of derivatives in real-world scenarios, such as maximizing productivity and minimizing costs. The script concludes with a discussion on graphing functions using the first derivative test to understand the function's behavior and identify its key features without plotting every point.
Takeaways
- 📈 Derivatives are essential for optimization, helping to find the balance between maximization and minimization of cost in real-world scenarios with limited resources.
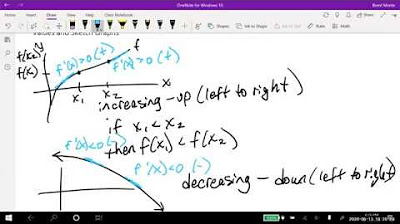
- 🔍 To determine where a function is increasing or decreasing, analyze the sign of the derivative. A positive derivative indicates an increasing function, while a negative sign indicates a decreasing function.
- 🌟 Critical values are points where the derivative is either zero or undefined and represent potential transition points from increasing to decreasing or vice versa.
- 📌 The first derivative test is a method to assess whether a critical value is a relative maximum, minimum, or neither, by examining the sign of the derivative around the critical point.
- 🔑 The concept of relative extrema refers to the highest or lowest values of a function in relation to the points around them, not necessarily the absolute maximum or minimum on the entire graph.
- 🧮 To find critical values, set the derivative equal to zero and solve for x, or identify where the derivative is undefined, such as at discontinuities or sharp corners.
- 📊 The graph of the derivative can provide a visual representation of where the original function is increasing or decreasing, with the x-axis crossings indicating critical values.
- 🤔 The actual maximum or minimum values of a function are found by evaluating the function at its critical points, not just by identifying the critical points themselves.
- 🛠️ The process of finding maxima and minima involves finding the derivative, setting it to zero (or acknowledging where it's undefined), solving for x to find critical values, and then applying the first derivative test.
- 📐 The shape of a function's graph, including its increasing and decreasing intervals, can be inferred from the derivative's sign and behavior, which is crucial for sketching the function's graph accurately.
- ✅ The first derivative test and the analysis of critical values are powerful tools in calculus that extend beyond pure mathematics to have practical applications in fields like economics, physics, and engineering.
Q & A
What is the main topic discussed in the video?
-The main topic discussed in the video is the application of derivatives in optimization, specifically focusing on how to find critical values and use them to identify maximum and minimum values of a function.
What does the term 'scarcity' refer to in the context of optimization?
-In the context of optimization, 'scarcity' refers to the limited availability of resources in real-world situations, which necessitates the wise use of those resources to achieve the best possible outcomes.
How are derivatives used to determine intervals of increase and decrease for a function?
-Derivatives are used to determine intervals of increase and decrease by analyzing the sign of the derivative. If the derivative is positive, the function is increasing; if it is negative, the function is decreasing.
What are critical values in the context of calculus?
-Critical values in calculus are the points where the derivative of a function is either zero or undefined. These points are significant because they often mark transitions from increasing to decreasing or vice versa on the function's graph.
How does the first derivative test help in identifying maximum and minimum values of a function?
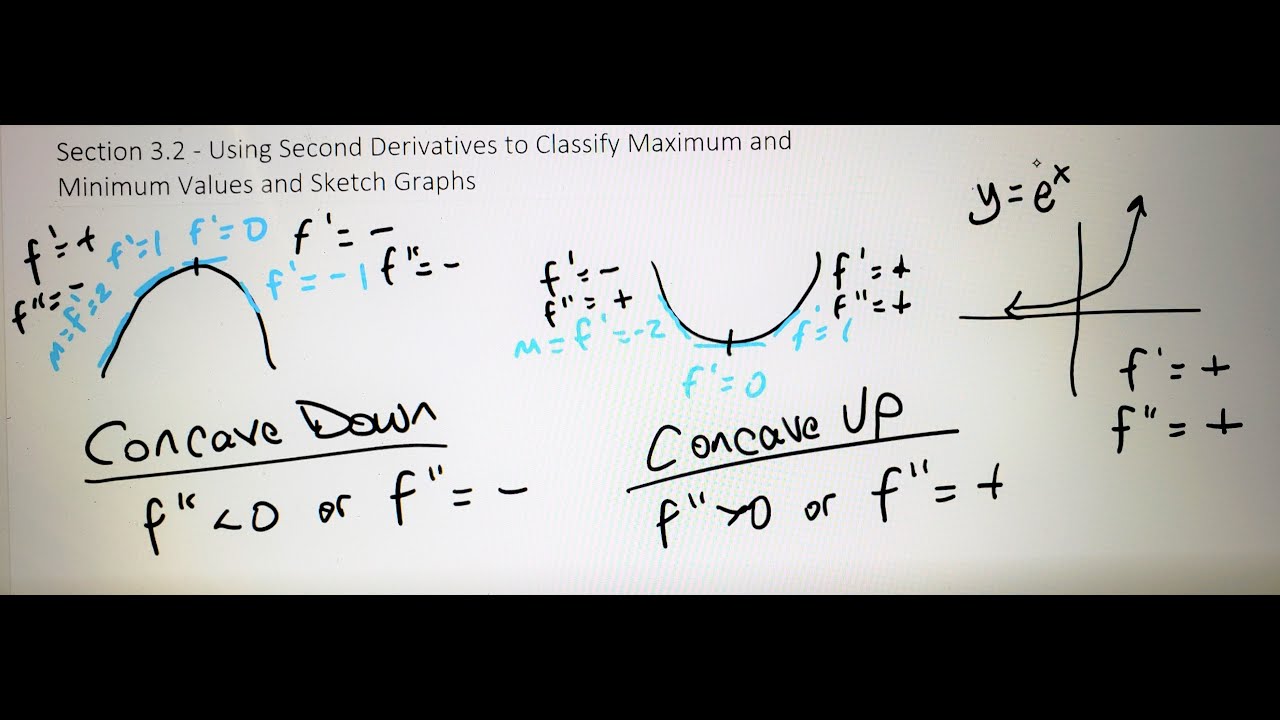
-The first derivative test helps in identifying maximum and minimum values by examining the sign of the derivative on either side of a critical value. If the derivative changes from negative to positive, it indicates a relative minimum; if it changes from positive to negative, it indicates a relative maximum.
What is the relationship between the slope of the tangent line and the derivative of a function at a given point?
-The slope of the tangent line at a given point on a function's graph is equal to the derivative of the function at that point. The derivative represents the rate of change or the slope of the tangent line at any specific point on the function.
Why is it important to consider the intervals of a function when analyzing its behavior?
-Considering the intervals of a function is important because it allows us to understand how the function behaves over its entire domain. It helps to identify where the function is increasing or decreasing, which in turn is crucial for finding maxima and minima.
What is the significance of a horizontal tangent line on a function's graph?
-A horizontal tangent line on a function's graph signifies that the derivative at that point is zero. This often occurs at critical points where the function transitions from increasing to decreasing or vice versa, which can correspond to maxima, minima, or points of inflection.
How can the graph of the derivative help in sketching the graph of the original function?
-The graph of the derivative can help in sketching the graph of the original function by providing information about where the function is increasing or decreasing. Additionally, points where the derivative is zero or undefined correspond to potential maximum or minimum points on the original function's graph.
What is the difference between a relative maximum and an absolute maximum?
-A relative maximum is a point where the function's value is higher than all the points around it within a given interval, but it may not be the highest value on the entire graph. An absolute maximum, on the other hand, is the highest point on the entire graph of the function.
Why is it necessary to find the derivative of a function when looking for its extrema?
-Finding the derivative of a function is necessary when looking for its extrema because the derivative indicates the slope of the tangent line to the function at a given point. A maximum or minimum occurs where the slope of the tangent line is zero (the derivative is zero) or undefined, which are the critical points to be analyzed for potential extrema.
Outlines
📈 Introduction to Derivatives in Optimization
The paragraph introduces the application of derivatives in optimization problems. It discusses how derivatives can be used to find the optimal balance between maximizing outputs and minimizing costs in real-world scenarios with limited resources. The concept of critical values is introduced as a pivotal element in determining intervals of increasing and decreasing functions, which are essential for optimization.
🔍 Understanding Increasing and Decreasing Functions
This section delves into the specifics of how to determine whether a function is increasing or decreasing. It explains the process of using the derivative to identify intervals of increase and decrease, and how a positive or negative slope of the tangent line (derivative) at any point on the function's graph indicates whether the function is increasing or decreasing at that point.
🍃 Identifying Critical Values and Their Significance
The paragraph focuses on critical values, which are points where the derivative is either zero or undefined. These points are significant because they represent potential transitions from increasing to decreasing or vice versa. The concept of relative maxima and minima is introduced, explaining how critical values can indicate the highest or lowest points in relation to surrounding points within an interval.
📌 The First Derivative Test and Its Application
This part explains the first derivative test, which is used to determine whether a critical point is a relative maximum, minimum, or neither. The test involves analyzing the sign of the derivative to the left and right of the critical value. The paragraph also clarifies the concept of relative extrema and how they relate to the behavior of the function around critical points.
🔢 Finding Critical Values and Analyzing Derivatives
The paragraph outlines a two-step process for solving maximization and minimization problems using the first derivative test. The first step is to find the critical values where the derivative is zero or undefined. The second step involves analyzing the sign of the derivative on either side of these critical values to determine the nature of the extremum at each critical point.
📚 Example Application of the First Derivative Test
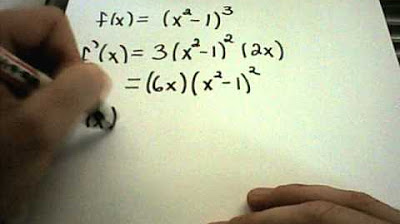
The paragraph provides a detailed example of applying the first derivative test to a specific function. It demonstrates how to find the derivative, set it to zero, factor it, and solve for critical values. Then, it shows how to use a sign chart to determine the intervals of increase and decrease, and finally, how to apply the first derivative test to find the relative extrema.
🔍 Factoring and Simplifying the Derivative
This section discusses the process of factoring and simplifying the derivative of a given function. It provides a shortcut for factoring quadratic trinomials and emphasizes the importance of verifying the factorization. The paragraph also explains how to adjust the factorization to account for changes made during the simplification process.
📈 Determining the Sign of the Derivative
The paragraph explains how to determine the sign of the derivative on different intervals using test values. It describes the process of selecting test values within each interval and using them to find the sign of the derivative, which indicates whether the function is increasing or decreasing over those intervals.
📈 Using the Derivative to Analyze Function Behavior
This section uses the derivative to analyze the behavior of a function. It explains how the sign of the derivative can indicate whether the function is increasing or decreasing over specific intervals. The paragraph also discusses how to interpret the graph of the derivative to understand the behavior of the original function.
🏔️ Locating Relative Maximum and Minimum Values
The paragraph focuses on identifying the locations of relative maximum and minimum values of a function. It explains how these values occur at critical points where the derivative changes sign. The process of evaluating the function at critical points to find the actual maximum and minimum values is also described.
🔧 Using the First Derivative Test for Different Functions
This section applies the first derivative test to different functions to find their relative extrema. It emphasizes the importance of finding critical values and analyzing the sign of the derivative around these points. The paragraph also demonstrates how to use the graph of the derivative to understand the behavior of the function.
📉 Sketching Functions Using Derivative Information
The final paragraph discusses how to sketch the graph of a function based on the information provided by its derivative. It outlines the process of using the first derivative test to determine where the function is increasing or decreasing and how this information can be used to sketch a rough graph of the function.
Mindmap
Keywords
💡Derivatives
💡Critical Values
💡Optimization
💡Scarcity
💡First Derivative Test
💡Relative Maximum/Minimum
💡Increasing/Decreasing Intervals
💡Sine Chart
💡Graphing Utility
💡Factoring
💡Chain Rule
Highlights
Derivatives are essential for optimization in real-world scenarios with limited resources.
Scarcity necessitates the maximization of outputs and minimization of costs, where derivatives play a crucial role.
Critical values are points where the derivative is either zero or undefined, indicating potential maxima or minima.
The first derivative test is a method to determine if a critical point is a maximum, minimum, or neither.
Relative maximum and minimum values are relative to the points around them, not the entire graph.
The sign of the derivative to the left and right of a critical value indicates whether it's a minimum or maximum.
The graph of the derivative can be used to interpret the behavior of the original function's graph.
The first derivative test involves analyzing the sign of the derivative around critical values to find extrema.
The process of finding critical values and applying the first derivative test is a systematic approach to optimization problems.
The concept of intervals is crucial for understanding where a function is increasing or decreasing.
The shape of a function's graph can be inferred from the behavior of its derivative, such as identifying peaks and valleys.
Graphical analysis of the derivative can provide a quick overview of a function's increasing and decreasing intervals.
The actual maximum and minimum values can be found by evaluating the function at its critical points.
Graphing utilities can be used to verify the function's behavior and the locations of its extrema.
The first derivative test is a powerful tool for analyzing the extrema of functions in mathematical and real-world problems.
The method of factoring and using a sign chart is demonstrated for finding critical values and understanding function behavior.
The importance of understanding the relationship between a function's derivative and its graph's slope is emphasized for optimization.
Transcripts


5.0 / 5 (0 votes)
Thanks for rating: