The Graphs of Sine and Cosine (Precalculus - Trigonometry 11)
TLDRThe video script offers an in-depth exploration of the sine and cosine functions, focusing on the transition from understanding these functions in the context of the unit circle to graphing them on an x-y coordinate system. It emphasizes the importance of recognizing that the 'x' in these functions represents an angle or arc length on a unit circle, not the x-coordinate on the circle itself. The script clarifies the concept of the period of sine and cosine, which is 2π, and explains how the functions behave within this period, with sine peaking at the quarters and cosine at the ends and center. The domain of both functions is all real numbers, and their range lies between -1 and 1. The video also distinguishes between sine as an odd function and cosine as an even function. It lays the groundwork for future discussions on transformations, including phase shifts, amplitude adjustments, and horizontal and vertical stretches or compressions.
Takeaways
- 📐 The x-axis in the context of sine and cosine functions represents an angle or arc length on a unit circle, not a traditional x-coordinate.
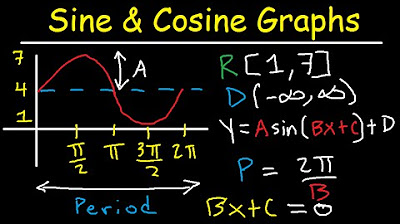
- 🔁 Both sine and cosine functions have a period of 2π, meaning their graphs repeat every 2π radians.
- 📶 The domain of sine and cosine functions is all real numbers, allowing for an infinite range of angles and arc lengths.
- 📉 The range of sine and cosine functions is between -1 and 1, inclusive, representing the maximum and minimum y-values of the unit circle.
- ↔️ Sine is an odd function, while cosine is an even function, which affects their symmetry properties on the graph.
- ➗ Sine has x-intercepts at the center and ends of its period (0, π, 2π), and peaks at the quarters (π/2, 3π/2).
- ➡️ Cosine has x-intercepts at the corners of its period (π/2, 3π/2), and peaks at the ends and center (0, π, 2π).
- 🔄 Understanding the concept of phase shift is crucial as cosine can be seen as a phase-shifted version of sine.
- 📈 Key points for graphing sine and cosine include remembering the location of intercepts and peaks in relation to the period.
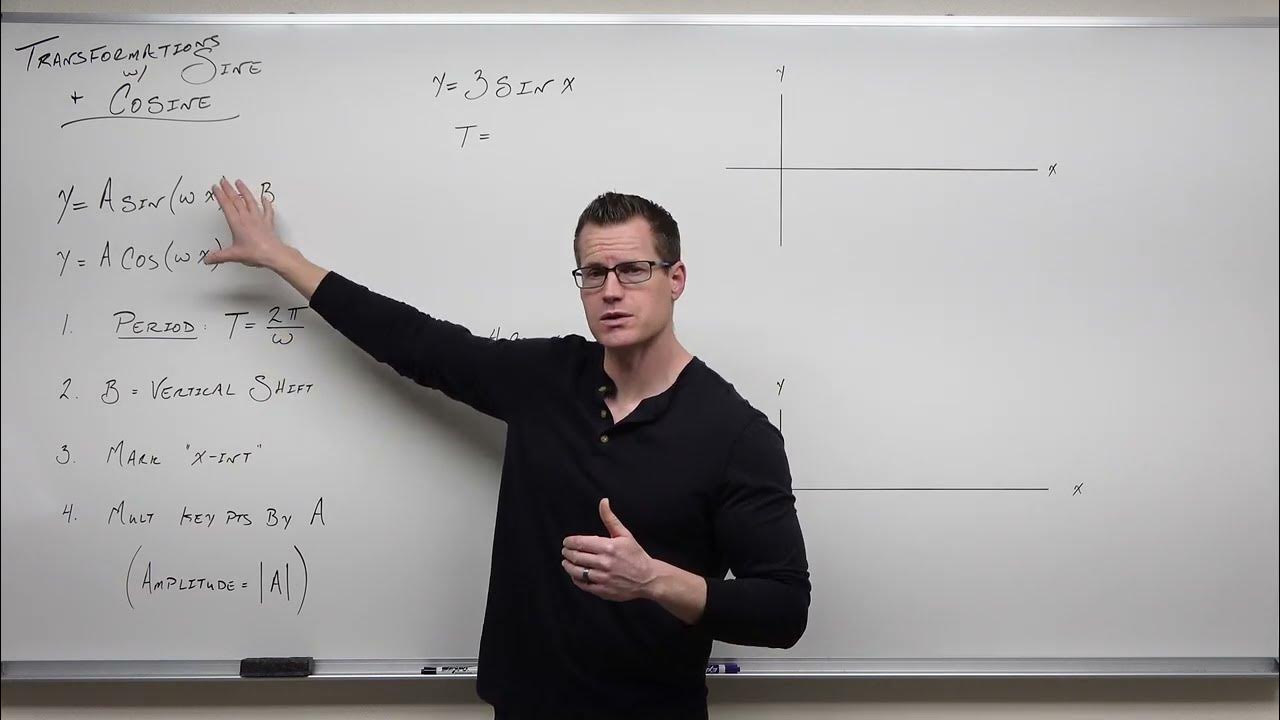
- 🔀 Transformations such as shifts, stretches, and compressions can be applied to the sine and cosine functions, affecting their graph.
- ✅ Grasping the relationship between the unit circle, angles, arc lengths, and the outputs of sine and cosine is fundamental for graphing and understanding these functions.
Q & A
What is the main challenge students face when transitioning from the unit circle to graphing sine and cosine functions?
-The main challenge is understanding that the 'x' in the function, such as sine or cosine, represents an angle or arc length on a unit circle, rather than a traditional x-coordinate on a graph.
What is the domain of the sine and cosine functions?
-The domain of both sine and cosine functions is all real numbers, as they can accept any real number as an input representing an angle in radians.
What is the period of the sine and cosine functions?
-The period of both sine and cosine functions is 2π radians, which means the functions repeat their values every 2π radians.
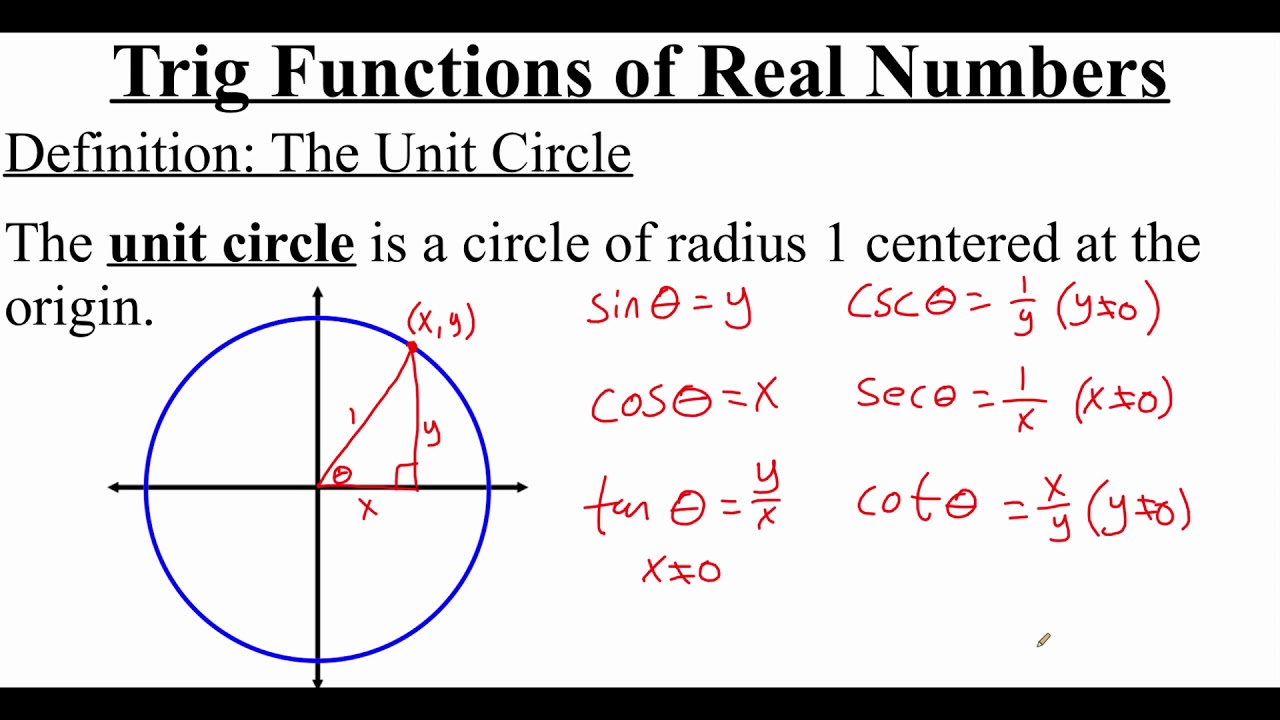
How are the sine and cosine functions related to the unit circle?
-The sine and cosine functions are related to the unit circle by representing the y-coordinate and x-coordinate, respectively, of a point on the unit circle corresponding to a given angle or arc length.
What is the range of the sine and cosine functions?
-The range of both sine and cosine functions is from -1 to 1, inclusive, as these are the maximum and minimum values that the sine and cosine of an angle can take.
Why are the sine and cosine functions considered to be odd and even functions, respectively?
-The sine function is considered odd because it is symmetric about the origin, meaning that sine(-x) = -sine(x). The cosine function is considered even because it is symmetric about the y-axis, meaning that cosine(-x) = cosine(x).
At what points does the sine function cross the x-axis?
-The sine function crosses the x-axis at every multiple of kπ, where k is an integer, specifically at 0, π, and 2π within the period of 2π.
At what points does the cosine function cross the x-axis?
-The cosine function crosses the x-axis at every point that is an odd multiple of π/2, such as π/2, 3π/2, 5π/2, etc.
What are the key points to remember when graphing the sine function?
-The key points for the sine function are the x-intercepts at the center and ends of the period (0, π, and 2π) and the peaks at the quarters of the period (π/2 and 3π/2).
What are the key points to remember when graphing the cosine function?
-The key points for the cosine function are the x-intercepts at the corners of the period (π/2, 3π/2) and the peaks at the ends and center of the period (0 and π).
How can understanding the unit circle help in graphing transformations of sine and cosine functions?
-Understanding the unit circle helps in graphing transformations by providing a visual and conceptual framework for how the functions behave with respect to angles and arc lengths, which translates into horizontal and vertical shifts, stretches, and compressions on the graph.
Outlines
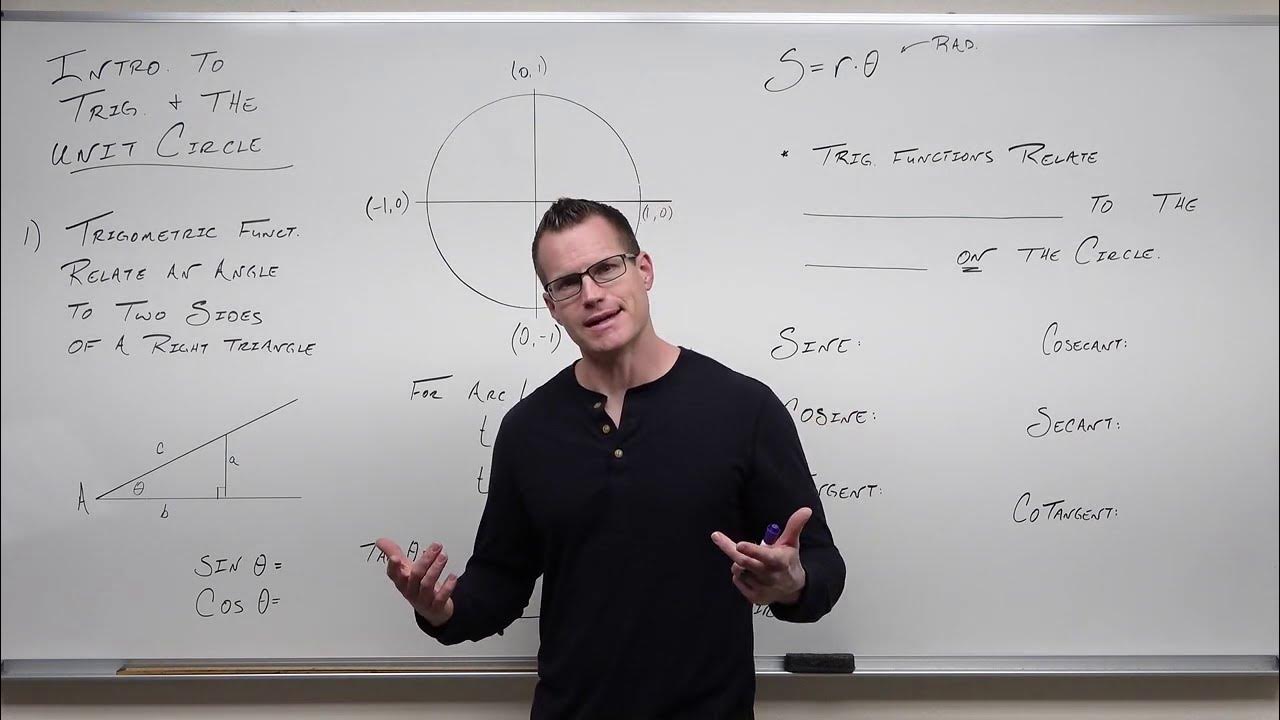
😀 Introduction to Sine and Cosine Graphs
The video begins with an introduction to the graphs of sine and cosine functions. The speaker emphasizes the common confusion students face when transitioning from the unit circle to the Cartesian coordinate system, particularly with the variable x representing both the input angle and the horizontal axis. The video promises to delve into the origins of these graphs, their periodic nature, and the importance of understanding the period and amplitude of sine and cosine functions. It also hints at discussing how to apply transformations to these functions in subsequent videos.
📈 Understanding Sine Function Values
This paragraph focuses on the values of the sine function at specific angles, such as 0, π, 2π, and others. The speaker explains that the sine function will output 0 at 0 and π, and it will repeat its values every 2π, indicating the periodic nature of the sine function. The domain of the sine function is all real numbers, and the range is between -1 and 1, inclusive. The paragraph also discusses the concept of the unit circle and how the sine of an angle corresponds to the y-coordinate of a point on the unit circle.
🔁 Periodicity and Key Features of Sine
The speaker recaps the concept of the sine function's periodicity, emphasizing that the function repeats itself every 2π radians. Key features of the sine graph are highlighted, such as the fact that it is an odd function, meaning it is symmetric about the origin. The x-intercepts occur at 0, π, and 2π, and the function peaks at the quarters of the period. The importance of understanding these features for graphing and applying transformations is stressed.
🤔 Key Points for Sine Graphing
The paragraph discusses the key points necessary for graphing the sine function, including its x-intercepts and peaks. It is emphasized that regardless of the period, the sine function will always cross the x-axis at the ends and center of the period and peak at the quarters. The speaker provides a method for graphing sine by identifying these key points and adjusting them according to the amplitude and period of the function.
🌟 Cosine Function and Its Relationship with Sine
The focus shifts to the cosine function, which is described as a phase shift of the sine function. The cosine function's values at various angles are explored, and it is shown that cosine behaves similarly to sine but with a phase difference. The cosine function is an even function, symmetric about the y-axis, and has the same period of 2π and a range of -1 to 1. The speaker also clarifies the confusion regarding the variable x in cosine, explaining that it represents an angle or arc length on the unit circle, not the x-coordinate on the Cartesian plane.
📊 Graphing Cosine Function
The paragraph explains how to graph the cosine function, noting its peaks at the ends and center of the period and x-intercepts at the corners. It is emphasized that the cosine function, like sine, has a period of 2π, but the key points for graphing are different due to the phase shift. The speaker provides the key points for the cosine function and explains how the amplitude can affect these points, leading to transformations such as stretching, compressing, and reflecting the graph.
🔍 Final Thoughts on Sine and Cosine Graphs
The video concludes with a summary of the key concepts for understanding and graphing sine and cosine functions. The speaker reiterates the importance of recognizing that the x-axis represents an angle or arc length on the unit circle and not the output of the function. The final thoughts encourage viewers to grasp these concepts, as understanding them provides a strong foundation for more advanced topics in calculus.
Mindmap
Keywords
💡Sine and Cosine Graphs
💡Unit Circle
💡Period
💡Amplitude
💡Phase Shift
💡Domain
💡Range
💡Odd and Even Functions
💡X-Intercepts
💡Key Points
💡Transformations
Highlights
The video discusses the graphs of sine and cosine functions, focusing on common student misconceptions about the argument of these functions.
Explains the relationship between the unit circle, angle, and arc length in the context of sine and cosine functions.
Clarifies that the x in sine and cosine functions represents an angle or arc length, not a coordinate on the unit circle.
Demonstrates how to find the sine of various angles and their corresponding outputs on the unit circle.
Shows that the sine function passes through the origin and has a domain of all real numbers.
Discusses the period of sine and cosine functions, which is 2π, and how it relates to their graphical representation.
Identifies key points for sine and cosine, such as where the functions cross the x-axis and where they peak.
Differentiates between the sine and cosine functions in terms of their graphical behavior, with sine being an odd function and cosine being an even function.
Provides a method to graph sine and cosine functions using key points and the understanding of their period.
Explains the concept of phase shift between sine and cosine functions and how it affects their graphs.
Details the process of graphing transformations of sine and cosine functions, including amplitude adjustments and period changes.
Teaches how to use the technique of shifting (up, down, left, right) and stretching/compressing for both sine and cosine functions.
Stresses the importance of understanding the unit circle's role in the definitions of sine and cosine for successful graphing.
Illustrates the x-intercepts and peak points of the cosine function, highlighting its similarities and differences with the sine function.
Discusses the range of sine and cosine functions, which is between -1 and 1, inclusive.
Provides a comprehensive understanding of why the graphs of sine and cosine look the way they do, emphasizing the importance of the unit circle.
Outlines the process for graphing sine and cosine functions with different periods by adjusting key points and x-intercepts.
The video concludes with a preview of the next video, which will cover how to apply transformations to the sine and cosine graphs.
Transcripts
Browse More Related Video

Trig 0.2 - Trig Functions Defined on the Unit Circle
Trigonometric Functions and the Unit Circle (Precalculus - Trigonometry 6)
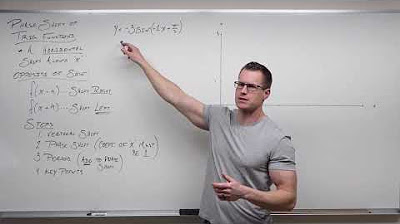
How to Graph Phase Shifts of Trigonometric Functions (Precalculus - Trigonometry 16)
4.3.4 Trigonometric Functions of Real Numbers
Graphing Sine and Cosine Trig Functions With Transformations, Phase Shifts, Period - Domain & Range
Graphing Transformations with Sine and Cosine (Precalculus - Trigonometry 12)
5.0 / 5 (0 votes)
Thanks for rating: